
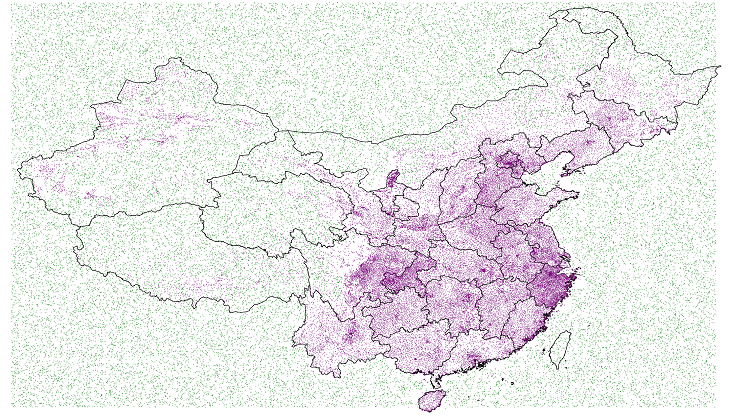
python 画散点图
# -*- coding: utf-8 -*-
from datetime import datetime


from mpl_toolkits.basemap import Basemap
import matplotlib.pyplot as plt

import open_file

# 把经纬度点映射到地图上

fig = plt.figure(figsize=(16, 8))
ax = fig.add_axes([0.1, 0.1, 0.7, 0.7])  # 添加坐标
# latlon_limit = [73.44, 135.08, 18.16, 53.56]  # 经纬度区间
latlon_limit = [72, 136, 18, 55]
# latlon_limit = [-180, 180, -90, 90]
m = Basemap(llcrnrlon=latlon_limit[0], llcrnrlat=latlon_limit[2], urcrnrlon=latlon_limit[1], urcrnrlat=latlon_limit[3],
            projection='cyl')

m.readshapefile("china-shapefiles-master/china", 'china', drawbounds=True)
m.drawmapboundary()  # 边 界
# m.fillcontinents()  # 大陆填充
drawparallels = [i for i in range(latlon_limit[2], latlon_limit[3], 5)]
drawmeridians = [i for i in range(latlon_limit[0], latlon_limit[1], 5)]
m.drawparallels(drawparallels, labels=[1, 0, 0, 0])  # 画出纬线  lables 设置显示对应纬度值
m.drawmeridians(drawmeridians, labels=[0, 0, 0, 1])  # 画出经线

marker, linewidths, dpi = '.', 0.6, 900  # 设置形状,边框大小,分辨率

xn_lat, xn_lon = open_file.open_xn('float')  # 虚拟站点
xn_lon, xn_lat = m(xn_lon, xn_lat)  # lon, lat为给定的经纬度,可以使单个的,也可以是列表
m.scatter(xn_lon, xn_lat, c='green', s=0.1, marker=marker, linewidths=linewidths)  # 标注出所在的点,s为点的大小,还可以选择点的性状和颜色等属

ys_lat, ys_lon = open_file.open_ys('float')  # 原始站点
ys_lon, ys_lat = m(ys_lon, ys_lat)  # lon, lat为给定的经纬度,可以使单个的,也可以是列表
m.scatter(ys_lon, ys_lat, c='purple', s=0.1, marker=marker, linewidths=linewidths)  # 标注出所在的点,s为点的大小,c为颜色

out_file = '%s_%s%s_%s.png' % (datetime.now().strftime('%Y%m%d%H%M&S'), marker, linewidths, dpi)
ax.axis('off')
plt.gca().xaxis.set_major_locator(plt.NullLocator())
plt.gca().yaxis.set_major_locator(plt.NullLocator())
plt.subplots_adjust(top=1, bottom=0, left=0, right=1, hspace=0, wspace=0)
plt.margins(0, 0)
plt.savefig(out_file, transparent=True, bbox_inches='tight', dpi=dpi, pad_inches=0.0, set_visiable=False, format='png')

# plt.show()

# plt.close()
https://blog.csdn.net/qq_38486203/article/details/80578260
https://ww2.mathworks.cn/help/matlab/ref/scatter.html#btrli6o-1

