


echarts 立体图
效果:
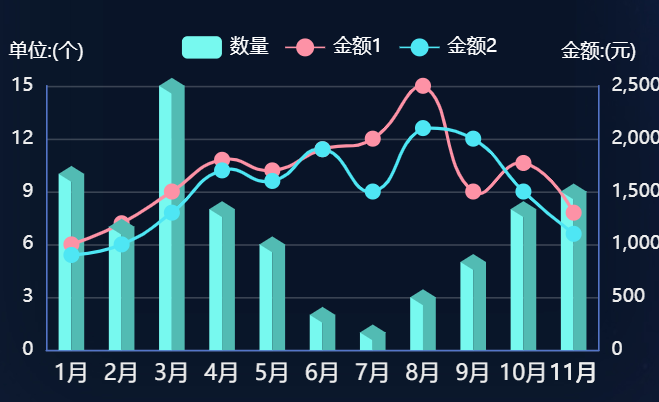


var indictedCase = [10, 7, 15, 8, 6, 2, 1, 3,5,8,9];
    var option = {

        tooltip: {
            trigger: "axis",
            backgroundColor: 'rgb(11,11,81)',
            padding: [15,30],
            extraCssText: 'box-shadow: 0px 0px 25px 5px rgb(41, 95, 159) inset;border-radius:10px'
        },
        legend: {
            show: true,
            top: '5%',
            textStyle: {
                color: "#fff"
            },
            data: ["数量", "金额1", "金额2"]
       },
       grid: {
          top: '20%',
          left: "3%",
          right: "4%",
          bottom: "2%",
          containLabel: true
       },
       xAxis: {
              type: "category",
              axisTick: {
                  show: false
              },
              axisLabel: {
                  //"rotate": 30,
                  interval: 0,
                  color: '#eee',
                  fontSize: 14
              },
              axisLine: {
                  lineStyle: {
                      color: "#5475c8"
                  }
              },
              data: ["1月", "2月", "3月", "4月", "5月", "6月", "7月", "8月", "9月", "10月", "11月"]
       },
       yAxis: [{
              type: "value",
              name: "单位:(个)",
              min: 0,
              // "max": leftMax*2,
              axisTick: {
                  show: false
              },
              splitLine: {
                  show: false,
               lineStyle: {
                   color: 'transparent'
               }
              },
              splitNumber: 5,
              axisLabel: {
                  show: true,
                  textStyle: {
                      color: "#eee"
                  }
              },
              nameTextStyle: {
                  color: "#fff"
              },
              axisLine: {
                  lineStyle: {
                      color: "#5475c8"
                  }
              }
       }, {
              type: "value",
              name: "金额:(元)",
              min: 0,
              // "max": 15000,
              axisTick: {
                  show: false
              },
              splitLine: {
               lineStyle: {
                   color: 'rgba(255,255,255,0.2)'
               }
              },
              splitNumber: 5,
              axisLabel: {
                  show: true,
                  textStyle: {
                      color: "#eee"
                  }
              },
              nameTextStyle: {
                  color: "#fff"
              },
              axisLine: {
                  lineStyle: {
                      color: "#5475c8"
                  }
              }
       }],
       series: [{
              name: "数量",
              type: "bar",
              barWidth: 8,
              barGap: 0,
              label: {
                  normal: {
                      show: false,
                      position: "insideRight"
                  }
              },
              itemStyle: {
                  normal: {
                      color: "#77f9ef"
                  }
              },
              data: indictedCase
       },{
              name: "数量",
              type: "bar",
              barWidth: 8,
              tooltip: {
                  show: false
              },
              label: {
                  normal: {
                      show: false,
                      position: "insideRight"
                  }
              },
              itemStyle: {
                  normal: {
                      color: "#52bbb3"
                  }
              },
              data: indictedCase
       },{
              name: "数量",
              type: "pictorialBar", // 长方体顶部四边形
            symbol: 'diamond',
            symbolRotate:0,
            symbolSize: ['16','10'],
            symbolOffset:['0','-5'],
            symbolPosition: 'end',
            z: 3, // 顶部四边形
              tooltip: {
                  show: false
              },
              label: {
                  normal: {
                      show: false,
                      position: "insideRight"
                  }
              },
              itemStyle: {
                  normal: {
                      color: "#52bbb3"
                  }
              },
              data: indictedCase
       }, {
              name: "金额1",
              type: "line",
              yAxisIndex: 1,
              showAllSymbol: true,
              symbol: "circle",
              symbolSize: 10,
              smooth: true,
              itemStyle: {
                  color: "rgb(253,146,166)"
              },
              lineStyle: {
                  color: "rgb(253,146,166)"
              },
              data: [1000,1200,1500,1800,1700,1900,2000,2500,1500,1770,1300]
       },{
              name: "金额2",
              type: "line",
              yAxisIndex: 1,
              showAllSymbol: true,
              symbol: "circle",
              symbolSize: 10,
              smooth: true,
              itemStyle: {
                  color: "rgb(78,230,244)"
              },
              lineStyle: {
                  color: "rgb(78,230,244)"
              },
              data: [900,1000,1300,1700,1600,1900,1500,2100,2000,1500,1100]
       }]
    }


【推荐】国内首个AI IDE,深度理解中文开发场景,立即下载体验Trae
【推荐】编程新体验,更懂你的AI,立即体验豆包MarsCode编程助手
【推荐】抖音旗下AI助手豆包,你的智能百科全书,全免费不限次数
【推荐】轻量又高性能的 SSH 工具 IShell:AI 加持,快人一步
· AI与.NET技术实操系列:基于图像分类模型对图像进行分类
· go语言实现终端里的倒计时
· 如何编写易于单元测试的代码
· 10年+ .NET Coder 心语,封装的思维:从隐藏、稳定开始理解其本质意义
· .NET Core 中如何实现缓存的预热?
· 分享一个免费、快速、无限量使用的满血 DeepSeek R1 模型,支持深度思考和联网搜索!
· 基于 Docker 搭建 FRP 内网穿透开源项目(很简单哒)
· ollama系列01:轻松3步本地部署deepseek,普通电脑可用
· 25岁的心里话
· 按钮权限的设计及实现