机器学习笔记(四)——多元线性回归(sklearn)
本博客仅用于个人学习,不用于传播教学,主要是记自己能够看得懂的笔记(
学习知识、资源和数据来自:机器学习算法基础-覃秉丰_哔哩哔哩_bilibili
所使用数据以及3D画图的说明可见:机器学习笔记(三)——多元线性回归(梯度下降法) - Lcy的瞎bb - 博客园 (cnblogs.com)
同样的,对于多元线性回归,我们同样可以使用sklearn来节省时间与精力。
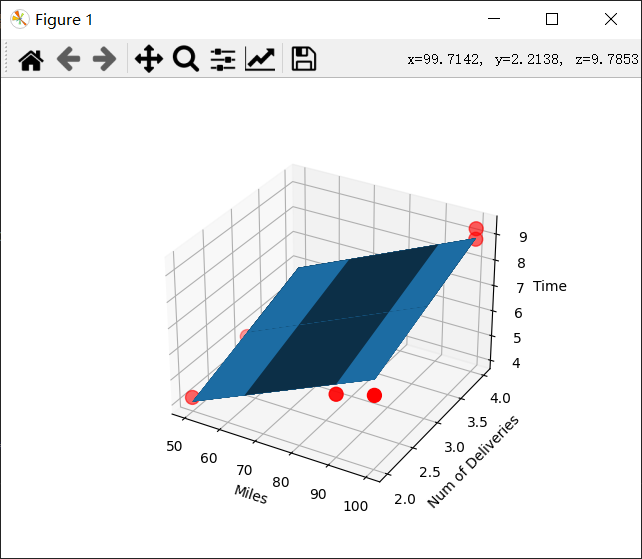
代码如下:
import numpy as np
from sklearn.linear_model import LinearRegression
import matplotlib.pyplot as plt
from mpl_toolkits.mplot3d import Axes3D

data=np.genfromtxt('C:/Users/Lenovo/Desktop/学习/机器学习资料/线性回归以及非线性回归/Delivery.csv',delimiter=',')
x_data=data[:,:-1]
y_data=data[:,-1]

#构建模型
model=LinearRegression()
model.fit(x_data,y_data)

#输出a,b,c
print('a={0},b={1},c={2}'.format(model.intercept_,model.coef_[0],model.coef_[1]))

#画3D图
fig=plt.figure()
ax=fig.add_subplot(111,projection='3d')
x0=x_data[:,0]
x1=x_data[:,1]
ax.scatter(x0,x1,y_data,marker='o',c='r',s=100)
x0,x1=np.meshgrid(x0,x1)
z=model.intercept_+model.coef_[0]*x0+model.coef_[1]*x1
ax.plot_surface(x0,x1,z)
ax.set_xlabel('Miles')
ax.set_ylabel('Num of Deliveries')
ax.set_zlabel('Time')
plt.show()
所得结果:
a=-0.8687014667817081,b=0.06113459879206212,c=0.9234253666954272


