【Azure 应用服务】更便捷的方式抓取Azure App Service for Windows的网络包
问题描述
在之前的一篇博文中,介绍了在App Service中抓取网络日志:
- 抓取Windows的网络包:【应用服务 App Service】App Service中抓取网络日志
- 抓取Linux的网络包:【Azure 应用服务】App Service For Linux 如何在 Web 应用实例上住抓取网络日志
现在,随着App Service的更新,Linnx也可以直接登录到SSH而不在需要复杂的配置操作。同时Windows环境中,也不在需要在本地安装 armclient.exe工具,而是直接通过 App Service的门户完成抓取,下载操作。
操作步骤
第一步: 进入App Service的Overview页面,点击“Diagnose and solve problems”, 然后再选择“ Diagnostic Tools” 方块
(注意: Diagnostic Tools路径变动,查看下图中的步骤)

第二步:选择 Collect Network Trace , 并设定抓取日志的时间长度, 60秒 ~ 15分钟的值供选择。页面中也对抓取网络日志的情况进行了说明:
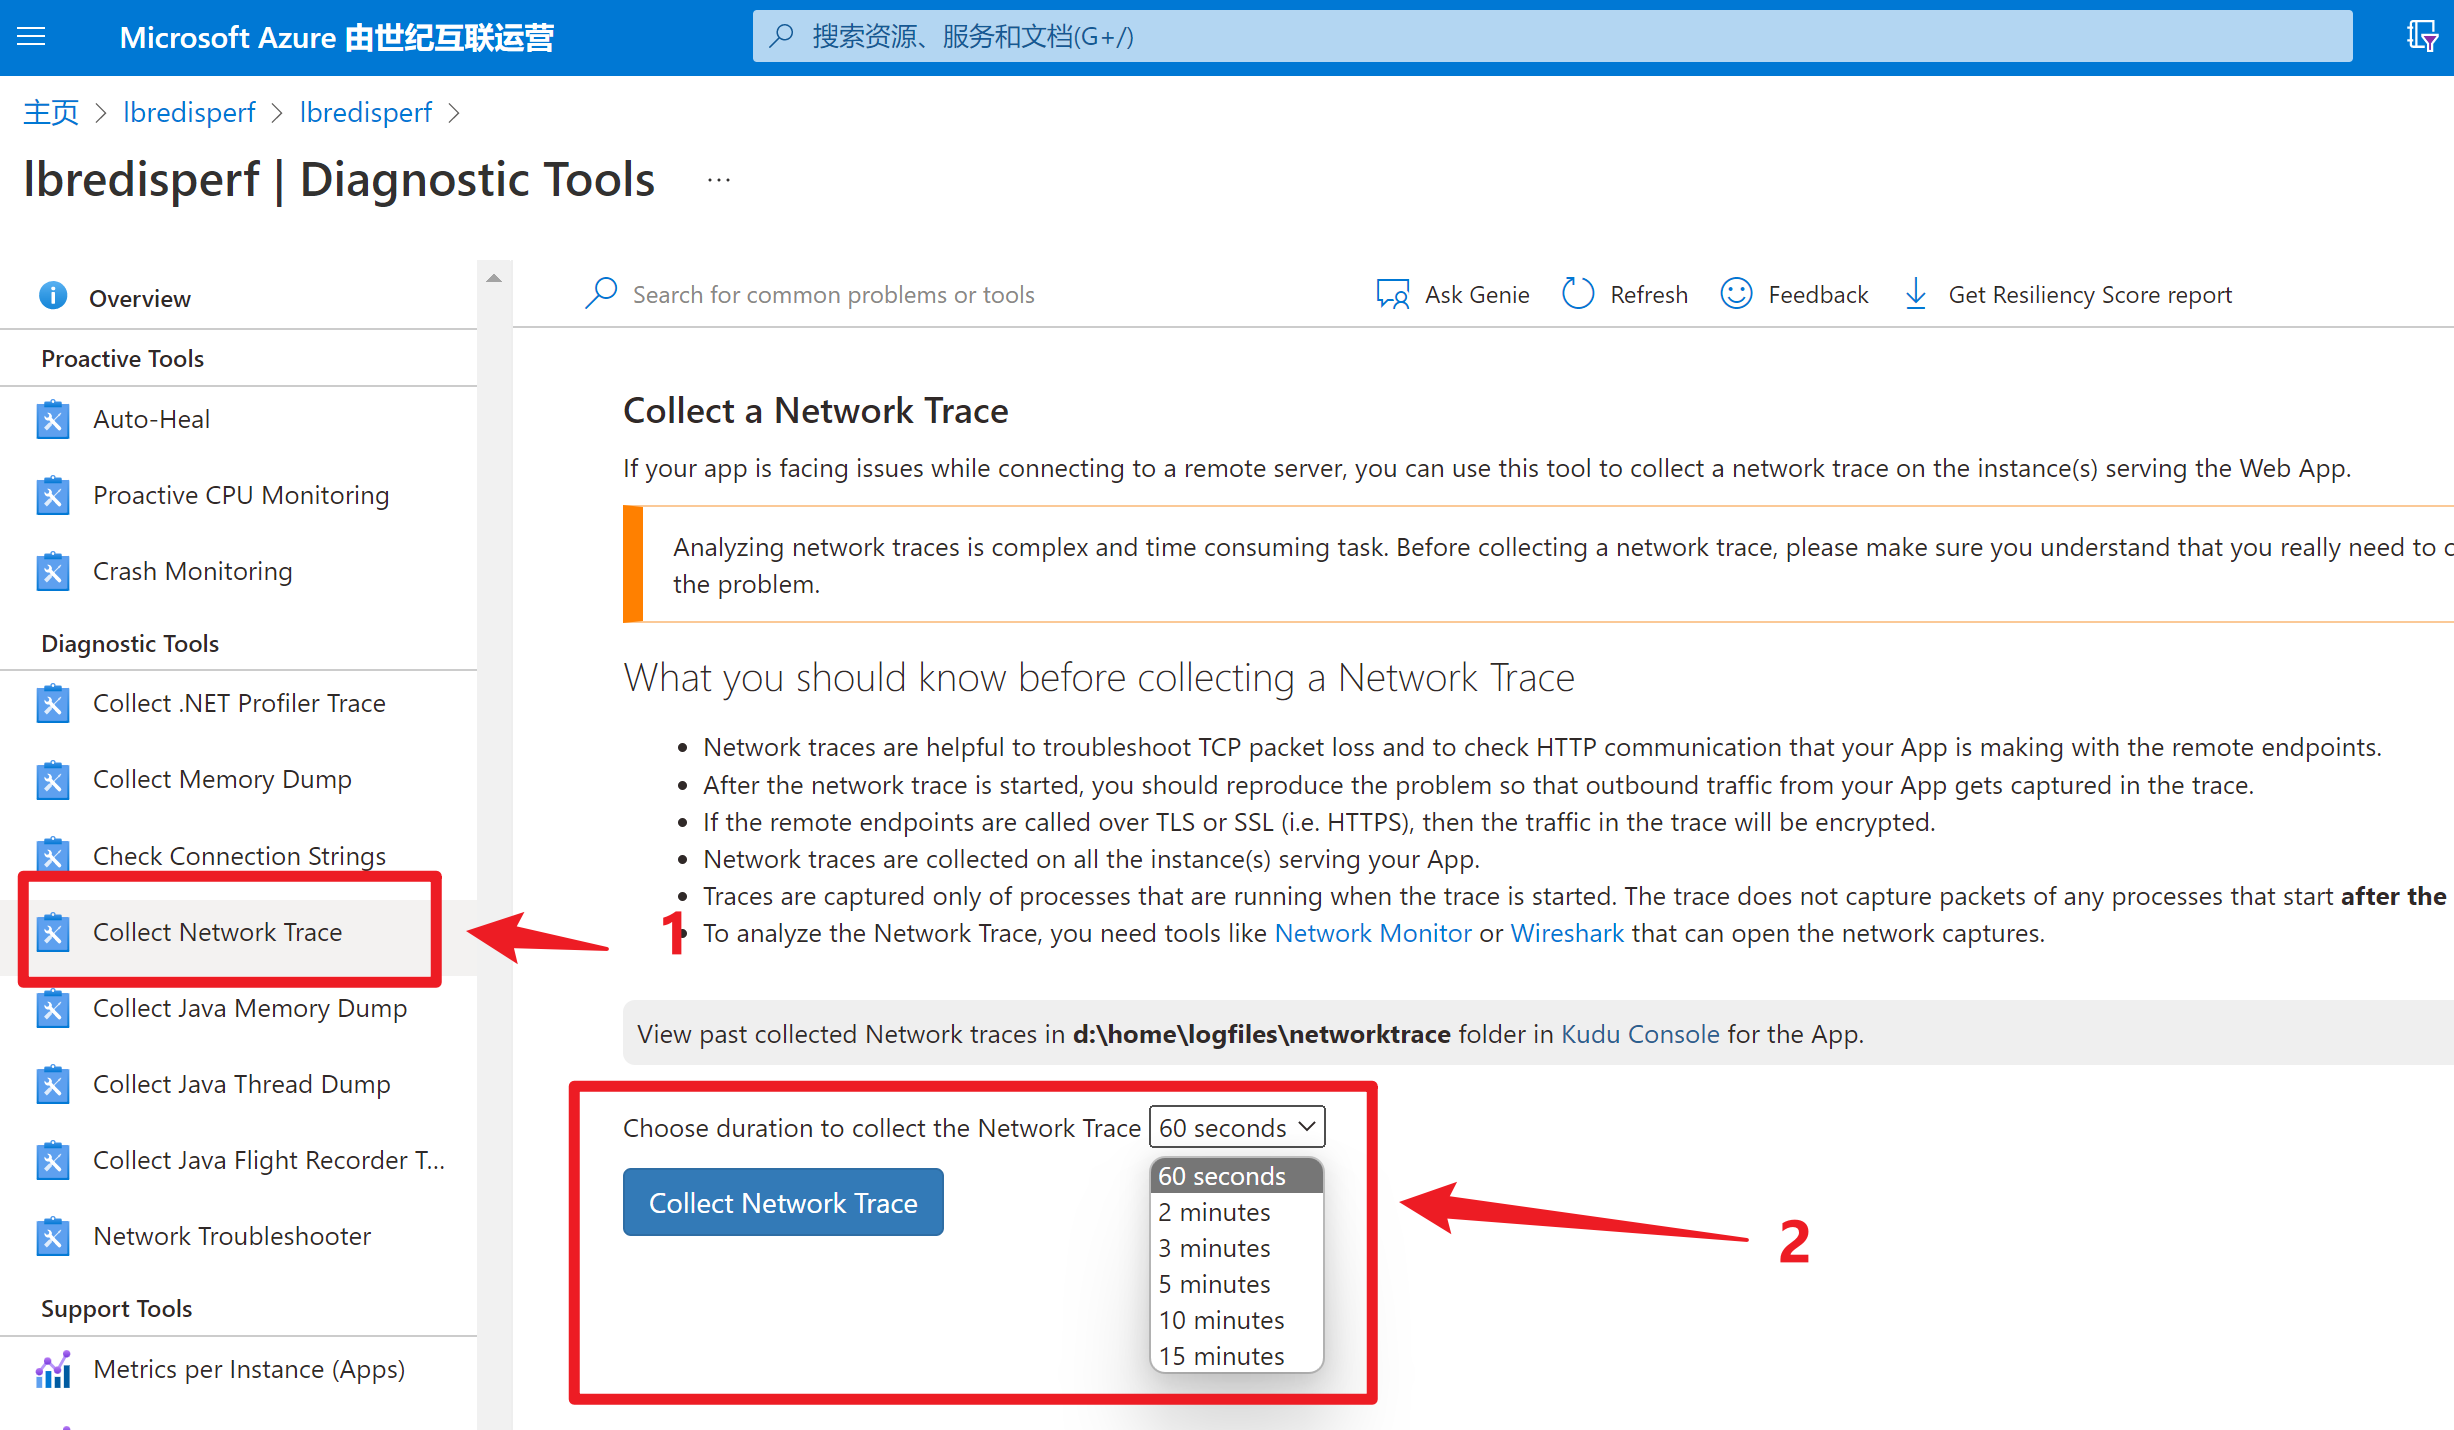
Collect a Network Trace
If your app is facing issues while connecting to a remote server, you can use this tool to collect a network trace on the instance(s) serving the Web App.
Analyzing network traces is complex and time consuming task. Before collecting a network trace, please make sure you understand that you really need to collect a network trace to troubleshoot the problem.
What you should know before collecting a Network Trace
- 网络日志帮助定位TCP丢包,检查App Service与其他服务之间的HTTP通信情况(Network traces are helpful to troubleshoot TCP packet loss and to check HTTP communication that your App is making with the remote endpoints.)
- 在开始抓取网络日志后,要在App Service上重新我们需要抓包解决的问题(After the network trace is started, you should reproduce the problem so that outbound traffic from your App gets captured in the trace.)
- 如果适用HTTPS,那么数据将被加密(If the remote endpoints are called over TLS or SSL (i.e. HTTPS), then the traffic in the trace will be encrypted.)
- 将会收集应用所在的全部实例上的网络包(Network traces are collected on all the instance(s) serving your App.)
- 抓取网络日志只包含当前正在运行进程。当抓取网络包开始后,新的进程的网络包将不被抓取(Traces are captured only of processes that are running when the trace is started. The trace does not capture packets of any processes that start after the capture is started.)
- 可以适用Network Monitor和Wireshark工具对网络包进行分析(To analyze the Network Trace, you need tools like Network Monitor or Wireshark that can open the network captures.)
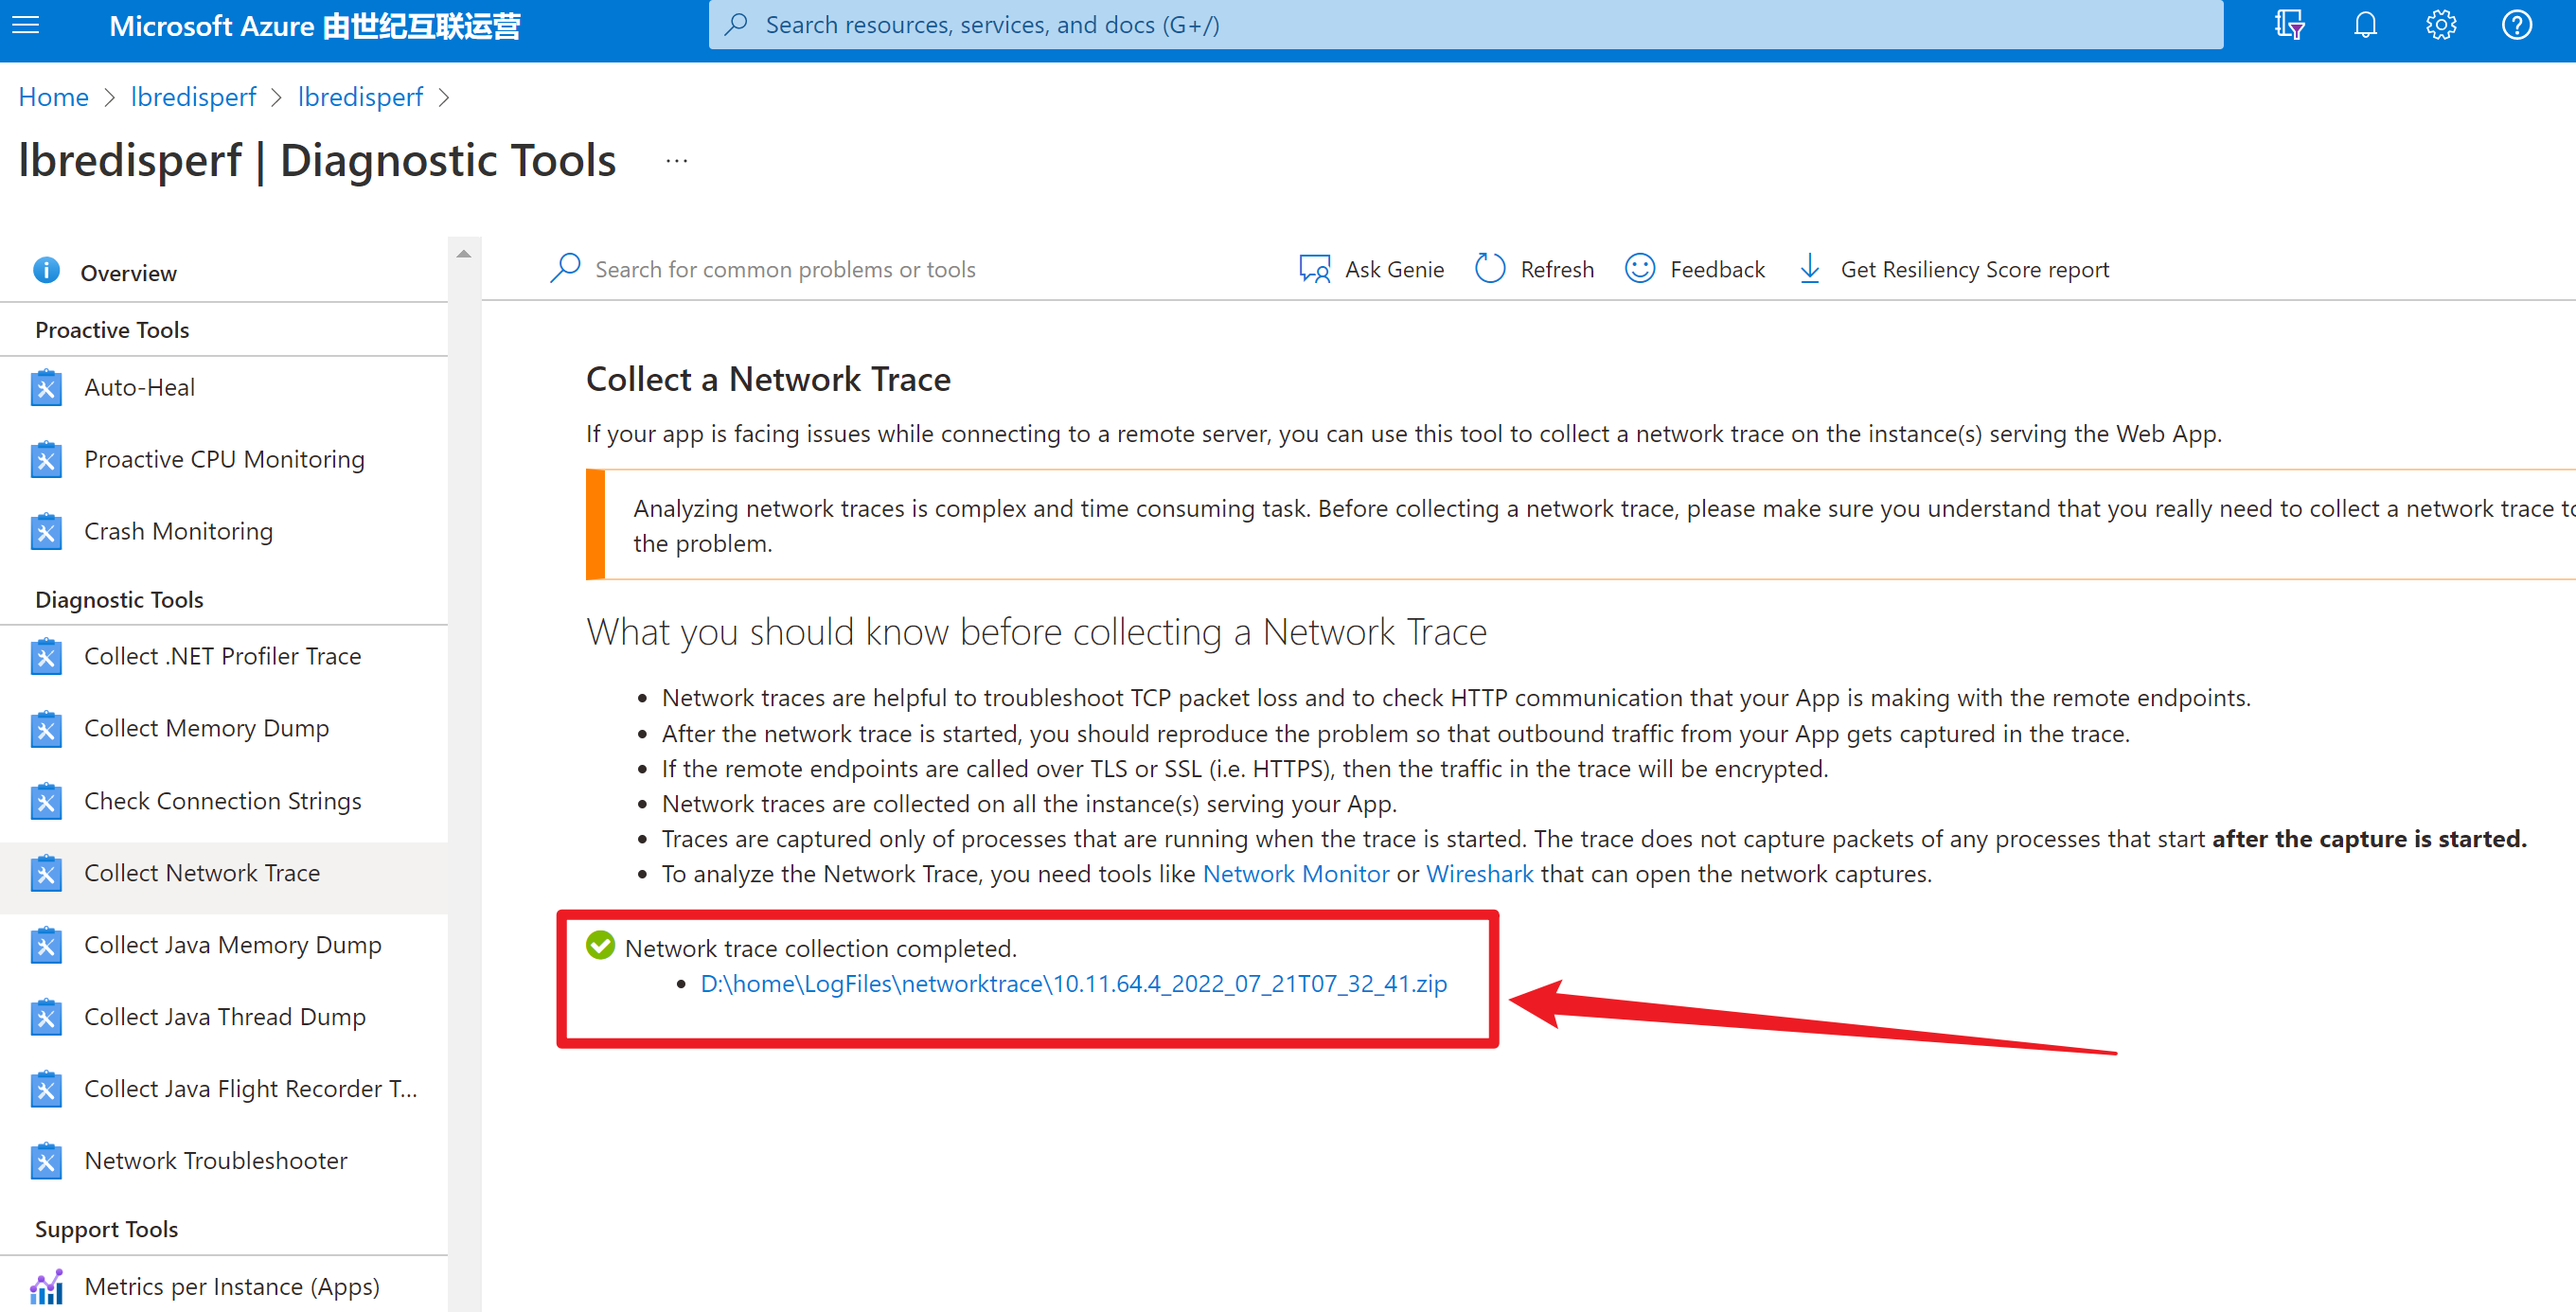
第三步:等待抓取时间完成,页面会直接显示网络包的下载地址。点击即可。
PS:此处不需要在登录到Kudu站点中,到 c:\home\logfiles\networktrace 目录中进行下载,但是如果要查看历史的网络抓包文件,还是需要到Kudu站点中下载。
注意:当前App Service For Linux环境,还是不支持以上方式抓包。 需要SSH,然后执行以下命令:
tcpdump -i any host <your app service inbound ip address> and tcp port 443 -n -v -s 0 -w /tmp/appnetworktrace.pcap
[END]
当在复杂的环境中面临问题,格物之道需:浊而静之徐清,安以动之徐生。 云中,恰是如此!

 浙公网安备 33010602011771号