
WPF oxyPlot 使用总结
oxyPlot能够简易的创建图表并且该库也在Github上面开源直通门。以下是笔者基础使用总结。本文例子的源码下载
1、安装与引用
新建一个wpf应用程序,然后使用Nuget控制台安装OxyPlot和OxyPlot.wpf直接键入。
Install-Package Oxyplot
Install-Package Oxyplot.Wpf
你也可以在应用程序-->“引用”-->"右键"-->"管理Nuget包"进行检索oxyplot关键字,可以看到相应的类库引用。(吐槽下:Nuget访问很慢)
你也可以直接通过上面的直通门去下载最新的源码自己编译。
到此,已经将Oxyplot的类库引用到指定的应用程序上。
2、 创建PlotViewModel简易画曲线
在OxyPlot内部可以通过Serial进行定义图表,包含:LineSerial(线条--可以通过定义点进行画线条)、FunctionSerial(函数曲线)、AreaSerial(区域)、StairSerial等,笔者就只用到前两者。
接下来实现一个画直线以及sin(x)的函数线的例子进行说明。
在PlotViewModel内部添加SimplePlotModel属性(类型:PlotModel),并且在PlotViewMode构造函数内部进行实例化,同时将定义好的直线以及sin(x)函数线添加该属性上。在MainWindow.xaml进行定义PlotView标签,同时绑定SimplePlotModel。具体的实现如下代码
PlotViewModel构造函数
public PlotViewModel()
{
SimplePlotModel=new PlotModel();
//线条
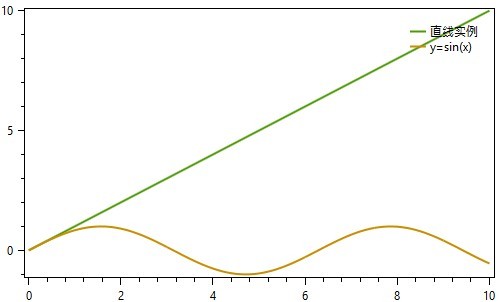
var lineSerial = new LineSeries() { Title="直线实例"};
lineSerial.Points.Add(new DataPoint(0, 0));
lineSerial.Points.Add(new DataPoint(10, 10));
SimplePlotModel.Series.Add(lineSerial);
//函数sin(x)
var funcSerial = new FunctionSeries((x) => { return Math.Sin(x); }, 0, 10, 0.1, "y=sin(x)");
SimplePlotModel.Series.Add(funcSerial);
}
MainWindow.xmal
  <Grid>
        <oxy:PlotView Model="{Binding Path= SimplePlotModel}"></oxy:PlotView>

    </Grid>

  /// <summary>
    /// MainWindow.xaml 的交互逻辑
    /// </summary>
    public partial class MainWindow : Window
    {
        private PlotViewModel _viewModel;

        public MainWindow()
        {
            InitializeComponent();
            _viewModel = new PlotViewModel();
            //画直线
            this.DataContext = _viewModel;
        }
    }
将会得到如下图所示的图标
3、定制坐标轴
在OxyPlot可以通过Axes进行自定义坐标轴,其中包含了LinearAxis、DateAxis、LogarithmicAxis、 CategoryAxis等比较实用的坐标轴
我们可以直接定义一个LinearAxis进行定义X、Y轴从0开始,最大10,如下例举比较常用的坐标轴属性(PS:x轴的设置想类似),效果如下图所示
        //定义y轴
            LinearAxis leftAxis = new LinearAxis()
            {
                 Position=AxisPosition.Left,
                 Minimum=0,
                 Maximum=10,
                 Title = "Y轴",//显示标题内容
                 TitlePosition = 1,//显示标题位置
                 TitleColor = OxyColor.Parse("#d3d3d3"),//显示标题位置
                 IsZoomEnabled = false,//坐标轴缩放关闭
                 IsPanEnabled = false,//图表缩放功能关闭
                 //MajorGridlineStyle = LineStyle.Solid,//主刻度设置格网
                 //MajorGridlineColor = OxyColor.Parse("#7379a0"),
                 //MinorGridlineStyle = LineStyle.Dot,//子刻度设置格网样式
                 //MinorGridlineColor = OxyColor.Parse("#666b8d")
            };
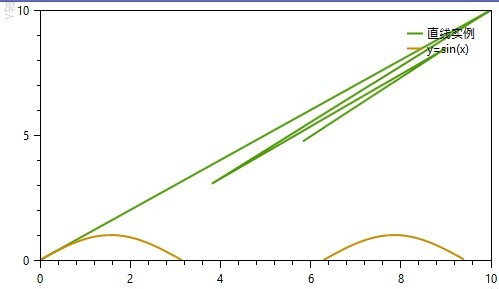
4、实时动态添加曲线
现实当中我们比较常用的实时获取数据生成曲线,所以我们可以通过调用SimplePlotModel.InvalidatePlot(true)进行刷新xmal上的图像。笔者只以简单的直线添加点进行动态生成线条,相应的代码如下所示:
      var rd = new Random();
            Task.Factory.StartNew(() =>
            {
                while (true)
                {
                    var x = rd.NextDouble() * 1000 % 10;
                    var y = rd.NextDouble() * 50 % 9;
                    lineSerial.Points.Add(new DataPoint(x, y));
                    SimplePlotModel.InvalidatePlot(true);
                    Thread.Sleep(500);
                }
            });
5、本文例子的源码下载
源码 (如果觉得不错请点赞下,有误的话请指出,卤鸽在此感谢)
参考材料
http://blog.csdn.net/coolfeiweb/article/details/23454141?utm_source=tuicool
http://oxyplot.org/documentation

 浙公网安备 33010602011771号