初始化、正则化、梯度检验
任务
一、初始化参数:
- 使用0来初始化参数。
- 使用随机数来初始化参数。
- 使用抑梯度异常初始化参数(参见视频中的梯度消失和梯度爆炸)。
二、正则化模型:
- 使用二范数对二分类模型正则化,尝试避免过拟合。
- 使用随机删除节点的方法精简模型,同样是为了尝试避免过拟合。
三、梯度校验 :
- 对模型使用梯度校验,检测它是否在梯度下降的过程中出现误差过大的情况。
import numpy as np
import matplotlib.pyplot as plt
import sklearn
import sklearn.datasets
import init_utils   #第一部分,初始化
import reg_utils    #第二部分,正则化
import gc_utils     #第三部分,梯度校验

%matplotlib inline

plt.rcParams['figure.figsize'] = (7.0, 4.0) # set default size of plots
plt.rcParams['image.interpolation'] = 'nearest'
plt.rcParams['image.cmap'] = 'gray'
初始化参数
# load image dataset: blue/red dots in circlesb
train_X, train_Y, test_X, test_Y = init_utils.load_dataset()
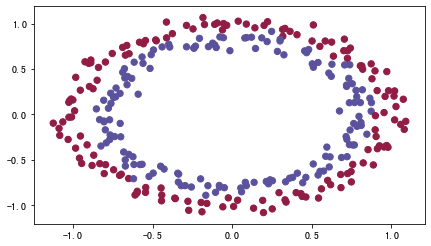
探索学习:
train_X.shape
(2, 300)
train_Y.shape
(1, 300)
# plt.scatter(train_X.T[:, 0], train_X.T[:, 1], c=np.squeeze(train_Y), s=40, cmap=plt.cm.Spectral); # 复现
plt.scatter()
- s:标量或shape大小为(n,)的数组,默认20(好像就是点的大小)
- c:表示的是颜色序列,默认蓝色’b’。c可以是一个RGB或RGBA二维行数组
- cmap = plt.cm.Spectral实现的功能是给label为1的点一种颜色,给label为0的点另一种颜色
- marker:表示的是标记的样式,可选,默认’o’
Neural Network model
尝试三种初始化方法:
- 初始化为0:在输入参数中全部初始化为0
- 初始化为随机数:把输入参数设置为随机值,权重初始化为大的随机值
- 抑梯度异常初始化
def model(X, Y, learning_rate = 0.01, num_iterations = 15000, print_cost = True, initialization = "he", is_polt=True):
    """
    Implements a three-layer neural network: LINEAR->RELU->LINEAR->RELU->LINEAR->SIGMOID.

    Arguments:
    X -- input data, of shape (2, number of examples)
    Y -- true "label" vector (containing 0 for red dots; 1 for blue dots), of shape (1, number of examples)
    learning_rate -- learning rate for gradient descent
    num_iterations -- number of iterations to run gradient descent
    print_cost -- if True, print the cost every 1000 iterations
    initialization -- flag to choose which initialization to use ("zeros","random" or "he")

    Returns:
    parameters -- parameters learnt by the model
    """

    grads = {}
    costs = [] # to keep track of the loss
    m = X.shape[1] # number of examples
    layers_dims = [X.shape[0], 10, 5, 1]

    # Initialize parameters dictionary.
    if initialization == "zeros":
        parameters = initialize_parameters_zeros(layers_dims)
    elif initialization == "random":
        parameters = initialize_parameters_random(layers_dims)
    elif initialization == "he":
        parameters = initialize_parameters_he(layers_dims)

    # Loop (gradient descent)

    for i in range(0,num_iterations):
        #前向传播
        a3 , cache = init_utils.forward_propagation(X,parameters)

        #计算成本
        cost = init_utils.compute_loss(a3,Y)

        #反向传播
        grads = init_utils.backward_propagation(X,Y,cache)

        #更新参数
        parameters = init_utils.update_parameters(parameters,grads,learning_rate)

        #记录成本
        if i % 1000 == 0:
            costs.append(cost)
            #打印成本
            if print_cost:
                print("第" + str(i) + "次迭代,成本值为:" + str(cost))

    # plot the loss
    if is_polt:
        plt.plot(costs)
        plt.ylabel('cost')
        plt.xlabel('iterations (per hundreds)')
        plt.title("Learning rate =" + str(learning_rate))
        plt.show()
    return parameters
Zero initialization
Exercise: Implement the following function to initialize all parameters to zeros.
def initialize_parameters_zeros(layers_dims):
    """
    Arguments:
    layer_dims -- python array (list) containing the size of each layer.

    Returns:
    parameters -- python dictionary containing your parameters "W1", "b1", ..., "WL", "bL":
                    W1 -- weight matrix of shape (layers_dims[1], layers_dims[0])
                    b1 -- bias vector of shape (layers_dims[1], 1)
                    ...
                    WL -- weight matrix of shape (layers_dims[L], layers_dims[L-1])
                    bL -- bias vector of shape (layers_dims[L], 1)
    """
    parameters = {}
    L  = len(layers_dims) # number of layers in the network

    for l in range(1, L):
        parameters['W' + str(l)] = np.zeros((layers_dims[l], layers_dims[l-1]))
        parameters['b' + str(l)] = np.zeros((layers_dims[l], 1))

    return parameters
parameters = initialize_parameters_zeros([3,2,1])
print("W1 = " + str(parameters["W1"]))
print("b1 = " + str(parameters["b1"]))
print("W2 = " + str(parameters["W2"]))
print("b2 = " + str(parameters["b2"]))
W1 = [[0. 0. 0.]
 [0. 0. 0.]]
b1 = [[0.]
 [0.]]
W2 = [[0. 0.]]
b2 = [[0.]]
parameters = model(train_X, train_Y, initialization = "zeros")
第0次迭代,成本值为:0.6931471805599453
第1000次迭代,成本值为:0.6931471805599453
第2000次迭代,成本值为:0.6931471805599453
第3000次迭代,成本值为:0.6931471805599453
第4000次迭代,成本值为:0.6931471805599453
第5000次迭代,成本值为:0.6931471805599453
第6000次迭代,成本值为:0.6931471805599453
第7000次迭代,成本值为:0.6931471805599453
第8000次迭代,成本值为:0.6931471805599453
第9000次迭代,成本值为:0.6931471805599453
第10000次迭代,成本值为:0.6931471805599455
第11000次迭代,成本值为:0.6931471805599453
第12000次迭代,成本值为:0.6931471805599453
第13000次迭代,成本值为:0.6931471805599453
第14000次迭代,成本值为:0.6931471805599453
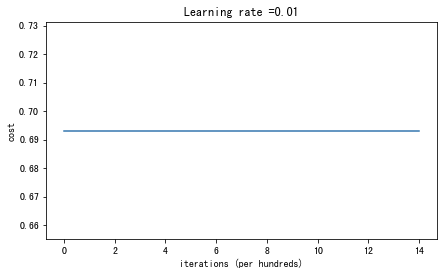
从上图中我们可以看到学习率一直没有变化,也就是说这个模型根本没有学习。我们来看看预测的结果怎么样:
print ("训练集:")
predictions_train = init_utils.predict(train_X, train_Y, parameters)
print ("测试集:")
predictions_test = init_utils.predict(test_X, test_Y, parameters)
训练集:
Accuracy: 0.5
测试集:
Accuracy: 0.5
print("predictions_train = " + str(predictions_train))
print("predictions_test = " + str(predictions_test))

plt.title("Model with Zeros initialization")
axes = plt.gca()
axes.set_xlim([-1.5, 1.5])
axes.set_ylim([-1.5, 1.5])
init_utils.plot_decision_boundary(lambda x: init_utils.predict_dec(parameters, x.T), train_X, train_Y)
predictions_train = [[0 0 0 0 0 0 0 0 0 0 0 0 0 0 0 0 0 0 0 0 0 0 0 0 0 0 0 0 0 0 0 0 0 0 0 0
  0 0 0 0 0 0 0 0 0 0 0 0 0 0 0 0 0 0 0 0 0 0 0 0 0 0 0 0 0 0 0 0 0 0 0 0
  0 0 0 0 0 0 0 0 0 0 0 0 0 0 0 0 0 0 0 0 0 0 0 0 0 0 0 0 0 0 0 0 0 0 0 0
  0 0 0 0 0 0 0 0 0 0 0 0 0 0 0 0 0 0 0 0 0 0 0 0 0 0 0 0 0 0 0 0 0 0 0 0
  0 0 0 0 0 0 0 0 0 0 0 0 0 0 0 0 0 0 0 0 0 0 0 0 0 0 0 0 0 0 0 0 0 0 0 0
  0 0 0 0 0 0 0 0 0 0 0 0 0 0 0 0 0 0 0 0 0 0 0 0 0 0 0 0 0 0 0 0 0 0 0 0
  0 0 0 0 0 0 0 0 0 0 0 0 0 0 0 0 0 0 0 0 0 0 0 0 0 0 0 0 0 0 0 0 0 0 0 0
  0 0 0 0 0 0 0 0 0 0 0 0 0 0 0 0 0 0 0 0 0 0 0 0 0 0 0 0 0 0 0 0 0 0 0 0
  0 0 0 0 0 0 0 0 0 0 0 0]]
predictions_test = [[0 0 0 0 0 0 0 0 0 0 0 0 0 0 0 0 0 0 0 0 0 0 0 0 0 0 0 0 0 0 0 0 0 0 0 0
  0 0 0 0 0 0 0 0 0 0 0 0 0 0 0 0 0 0 0 0 0 0 0 0 0 0 0 0 0 0 0 0 0 0 0 0
  0 0 0 0 0 0 0 0 0 0 0 0 0 0 0 0 0 0 0 0 0 0 0 0 0 0 0 0]]
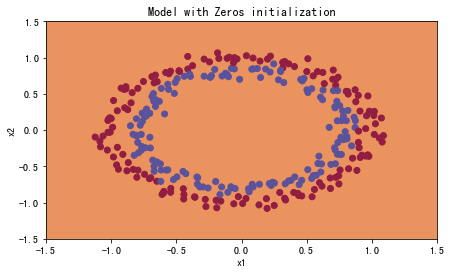
分类失败,该模型预测每个都为0。
通常来说,零初始化都会导致神经网络无法打破对称性,最终导致的结果就是无论网络有多少层,最终只能得到和Logistic函数相同的效果。
Random initialization
def initialize_parameters_random(layers_dims):
    """
    Arguments:
    layer_dims -- python array (list) containing the size of each layer.

    Returns:
    parameters -- python dictionary containing your parameters "W1", "b1", ..., "WL", "bL":
                    W1 -- weight matrix of shape (layers_dims[1], layers_dims[0])
                    b1 -- bias vector of shape (layers_dims[1], 1)
                    ...
                    WL -- weight matrix of shape (layers_dims[L], layers_dims[L-1])
                    bL -- bias vector of shape (layers_dims[L], 1)
    """

    np.random.seed(3)               # This seed makes sure your "random" numbers will be the as ours
    parameters = {}
    L = len(layers_dims)            # integer representing the number of layers

    for l in range(1, L):
        ### START CODE HERE ### (≈ 2 lines of code)
        parameters['W' + str(l)] = np.random.randn(layers_dims[l],layers_dims[l-1])*10
        parameters['b' + str(l)] = np.zeros((layers_dims[l],1))
        ### END CODE HERE ###

    return parameters
parameters = initialize_parameters_random([3, 2, 1])
print("W1 = " + str(parameters["W1"]))
print("b1 = " + str(parameters["b1"]))
print("W2 = " + str(parameters["W2"]))
print("b2 = " + str(parameters["b2"]))
W1 = [[ 17.88628473   4.36509851   0.96497468]
 [-18.63492703  -2.77388203  -3.54758979]]
b1 = [[0.]
 [0.]]
W2 = [[-0.82741481 -6.27000677]]
b2 = [[0.]]
parameters = model(train_X, train_Y, initialization = "random",is_polt=True)
print("训练集:")
predictions_train = init_utils.predict(train_X, train_Y, parameters)
print("测试集:")
predictions_test = init_utils.predict(test_X, test_Y, parameters)

print(predictions_train)
print(predictions_test)
/Users/ldc/Desktop/Project/深度学习wu/init_utils.py:50: RuntimeWarning: divide by zero encountered in log
  logprobs = np.multiply(-np.log(a3),Y) + np.multiply(-np.log(1 - a3), 1 - Y)
/Users/ldc/Desktop/Project/深度学习wu/init_utils.py:50: RuntimeWarning: invalid value encountered in multiply
  logprobs = np.multiply(-np.log(a3),Y) + np.multiply(-np.log(1 - a3), 1 - Y)


第0次迭代,成本值为:inf
第1000次迭代,成本值为:0.6250676215287511
第2000次迭代,成本值为:0.5981418252875961
第3000次迭代,成本值为:0.563858109377261
第4000次迭代,成本值为:0.5501823050061752
第5000次迭代,成本值为:0.5444756668990652
第6000次迭代,成本值为:0.5374638179631746
第7000次迭代,成本值为:0.4770885368883873
第8000次迭代,成本值为:0.397834663330821
第9000次迭代,成本值为:0.3934832163377203
第10000次迭代,成本值为:0.39203323866307854
第11000次迭代,成本值为:0.3892818629893498
第12000次迭代,成本值为:0.3861521882410713
第13000次迭代,成本值为:0.38499297516135134
第14000次迭代,成本值为:0.38280470097181446
训练集:
Accuracy: 0.83
测试集:
Accuracy: 0.86
[[1 0 1 1 0 0 1 1 1 1 1 0 1 0 0 1 0 1 1 0 0 0 1 0 1 1 1 1 1 1 0 1 1 0 0 1
  1 1 1 1 1 1 1 0 1 1 1 1 0 1 0 1 1 1 1 0 0 1 1 1 1 0 1 1 0 1 0 1 1 1 1 0
  0 0 0 0 1 0 1 0 1 1 1 0 0 1 1 1 1 1 1 0 0 1 1 1 0 1 1 0 1 0 1 1 0 1 1 0
  1 0 1 1 0 0 1 0 0 1 1 0 1 1 1 0 1 0 0 1 0 1 1 1 1 1 1 1 0 1 1 0 0 1 1 0
  0 0 1 0 1 0 1 0 1 1 1 0 0 1 1 1 1 0 1 1 0 1 0 1 1 0 1 0 1 1 1 1 0 1 1 1
  1 0 1 0 1 0 1 1 1 1 0 1 1 0 1 1 0 1 1 0 1 0 1 1 1 0 1 1 1 0 1 0 1 0 0 1
  0 1 1 0 1 1 0 1 1 0 1 1 1 0 1 1 1 1 0 1 0 0 1 1 0 1 1 1 0 0 0 1 1 0 1 1
  1 1 0 1 1 0 1 1 1 0 0 1 0 0 0 1 0 0 0 1 1 1 1 0 0 0 0 1 1 1 1 0 0 1 1 1
  1 1 1 1 0 0 0 1 1 1 1 0]]
[[1 1 1 1 0 1 0 1 1 0 1 1 1 0 0 0 0 1 0 1 0 0 1 0 1 0 1 1 1 1 1 0 0 0 0 1
  0 1 1 0 0 1 1 1 1 1 0 1 1 1 0 1 0 1 1 0 1 0 1 0 1 1 1 1 1 1 1 1 1 0 1 0
  1 1 1 1 1 0 1 0 0 1 0 0 0 1 1 0 1 1 0 0 0 1 1 0 1 1 0 0]]
分类效果:
plt.title("Model with large random initialization")
axes = plt.gca()
axes.set_xlim([-1.5, 1.5])
axes.set_ylim([-1.5, 1.5])
init_utils.plot_decision_boundary(lambda x: init_utils.predict_dec(parameters, x.T), train_X, train_Y)
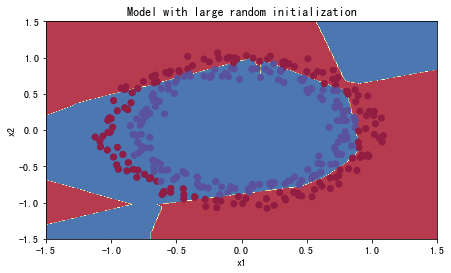
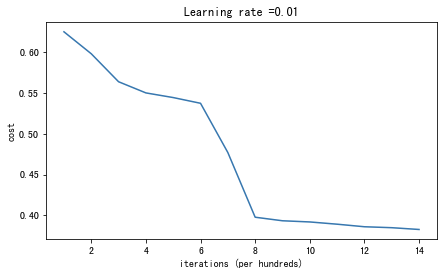
可以看到误差开始很高。这是因为由于具有较大的随机权重,当它出现错误时,它会导致非常高的损失。初始化参数如果没有很好地话会导致梯度消失、爆炸,这也会减慢优化算法。如果我们对这个网络进行更长时间的训练,我们将看到更好的结果,但是使用过大的随机数初始化会减慢优化的速度。
总而言之,将权重初始化为非常大的时候其实效果并不好。
He initialization

def initialize_parameters_he(layers_dims):
    """
    Arguments:
    layer_dims -- python array (list) containing the size of each layer.

    Returns:
    parameters -- python dictionary containing your parameters "W1", "b1", ..., "WL", "bL":
                    W1 -- weight matrix of shape (layers_dims[1], layers_dims[0])
                    b1 -- bias vector of shape (layers_dims[1], 1)
                    ...
                    WL -- weight matrix of shape (layers_dims[L], layers_dims[L-1])
                    bL -- bias vector of shape (layers_dims[L], 1)
    """

    np.random.seed(3)               # 指定随机种子
    parameters = {}
    L = len(layers_dims)            # 层数

    for l in range(1, L):
        parameters['W' + str(l)] = np.random.randn(layers_dims[l], layers_dims[l - 1]) * np.sqrt(2 / layers_dims[l - 1])
        parameters['b' + str(l)] = np.zeros((layers_dims[l], 1))

        #使用断言确保我的数据格式是正确的
        assert(parameters["W" + str(l)].shape == (layers_dims[l],layers_dims[l-1]))
        assert(parameters["b" + str(l)].shape == (layers_dims[l],1))

    return parameters
parameters = initialize_parameters_he([2, 4, 1])
print("W1 = " + str(parameters["W1"]))
print("b1 = " + str(parameters["b1"]))
print("W2 = " + str(parameters["W2"]))
print("b2 = " + str(parameters["b2"]))
W1 = [[ 1.78862847  0.43650985]
 [ 0.09649747 -1.8634927 ]
 [-0.2773882  -0.35475898]
 [-0.08274148 -0.62700068]]
b1 = [[0.]
 [0.]
 [0.]
 [0.]]
W2 = [[-0.03098412 -0.33744411 -0.92904268  0.62552248]]
b2 = [[0.]]
parameters = model(train_X, train_Y, initialization = "he",is_polt=True)
print("训练集:")
predictions_train = init_utils.predict(train_X, train_Y, parameters)
print("测试集:")
init_utils.predictions_test = init_utils.predict(test_X, test_Y, parameters)
第0次迭代,成本值为:0.8830537463419761
第1000次迭代,成本值为:0.6879825919728063
第2000次迭代,成本值为:0.6751286264523371
第3000次迭代,成本值为:0.6526117768893807
第4000次迭代,成本值为:0.6082958970572938
第5000次迭代,成本值为:0.5304944491717495
第6000次迭代,成本值为:0.4138645817071794
第7000次迭代,成本值为:0.3117803464844441
第8000次迭代,成本值为:0.23696215330322556
第9000次迭代,成本值为:0.18597287209206836
第10000次迭代,成本值为:0.15015556280371817
第11000次迭代,成本值为:0.12325079292273551
第12000次迭代,成本值为:0.09917746546525935
第13000次迭代,成本值为:0.08457055954024278
第14000次迭代,成本值为:0.07357895962677366
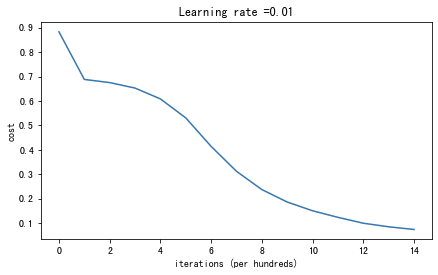
训练集:
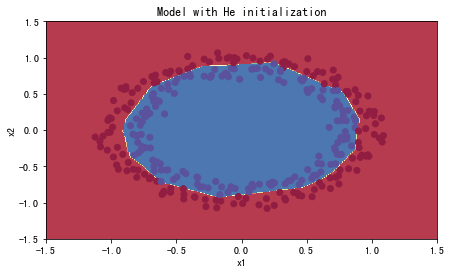
Accuracy: 0.9933333333333333
测试集:
Accuracy: 0.96
plt.title("Model with He initialization")
axes = plt.gca()
axes.set_xlim([-1.5, 1.5])
axes.set_ylim([-1.5, 1.5])
init_utils.plot_decision_boundary(lambda x: init_utils.predict_dec(parameters, x.T), train_X, train_Y)
总结:
- 不同的初始化方法可能导致性能最终不同
- 随机初始化有助于打破对称,使得不同隐藏层的单元可以学习到不同的参数
- 初始化时,初始值不宜过大
- He初始化搭配ReLU激活函数常常可以得到不错的效果
Regularization
要做以下三件事,来对比出不同的模型的优劣:
不使用正则化
使用正则化
- 使用L2正则化
- 使用随机节点删除
train_X, train_Y, test_X, test_Y = reg_utils.load_2D_dataset(is_plot=True)
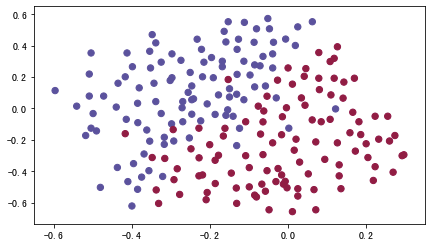
每一个点代表球落下的可能的位置,蓝色代表己方的球员会抢到球,红色代表对手的球员会抢到球,我们要做的就是使用模型来画出一条线,来找到适合我方球员能抢到球的位置。
def model(X,Y,learning_rate=0.3,num_iterations=30000,print_cost=True,is_plot=True,lambd=0,keep_prob=1):
    """
    实现一个三层的神经网络:LINEAR ->RELU -> LINEAR -> RELU -> LINEAR -> SIGMOID

    参数:
        X - 输入的数据,维度为(2, 要训练/测试的数量)
        Y - 标签,【0(蓝色) | 1(红色)】,维度为(1,对应的是输入的数据的标签)
        learning_rate - 学习速率
        num_iterations - 迭代的次数
        print_cost - 是否打印成本值,每迭代10000次打印一次,但是每1000次记录一个成本值
        is_polt - 是否绘制梯度下降的曲线图
        lambd - 正则化的超参数,实数
        keep_prob - 随机删除节点的概率
    返回
        parameters - 学习后的参数
    """
    grads = {}
    costs = []
    m = X.shape[1]
    layers_dims = [X.shape[0],20,3,1]

    #初始化参数
    parameters = reg_utils.initialize_parameters(layers_dims)

    #开始学习
    for i in range(0,num_iterations):
        #前向传播
        ##是否随机删除节点
        if keep_prob == 1:
            ###不随机删除节点
            a3 , cache = reg_utils.forward_propagation(X,parameters)
        elif keep_prob < 1:
            ###随机删除节点
            a3 , cache = forward_propagation_with_dropout(X,parameters,keep_prob)
        else:
            print("keep_prob参数错误!程序退出。")
            exit

        #计算成本
        ## 是否使用二范数
        if lambd == 0:
            ###不使用L2正则化
            cost = reg_utils.compute_cost(a3,Y)
        else:
            ###使用L2正则化
            cost = compute_cost_with_regularization(a3,Y,parameters,lambd)

        #反向传播
        ##可以同时使用L2正则化和随机删除节点,但是本次实验不同时使用。
        assert(lambd == 0  or keep_prob ==1)

        ##两个参数的使用情况
        if (lambd == 0 and keep_prob == 1):
            ### 不使用L2正则化和不使用随机删除节点
            grads = reg_utils.backward_propagation(X,Y,cache)
        elif lambd != 0:
            ### 使用L2正则化,不使用随机删除节点
            grads = backward_propagation_with_regularization(X, Y, cache, lambd)
        elif keep_prob < 1:
            ### 使用随机删除节点,不使用L2正则化
            grads = backward_propagation_with_dropout(X, Y, cache, keep_prob)

        #更新参数
        parameters = reg_utils.update_parameters(parameters, grads, learning_rate)

        #记录并打印成本
        if i % 1000 == 0:
            ## 记录成本
            costs.append(cost)
            if (print_cost and i % 10000 == 0):
                #打印成本
                print("第" + str(i) + "次迭代,成本值为:" + str(cost))

    #是否绘制成本曲线图
    if is_plot:
        plt.plot(costs)
        plt.ylabel('cost')
        plt.xlabel('iterations (x1,000)')
        plt.title("Learning rate =" + str(learning_rate))
        plt.show()

    #返回学习后的参数
    return parameters
Non-regularized
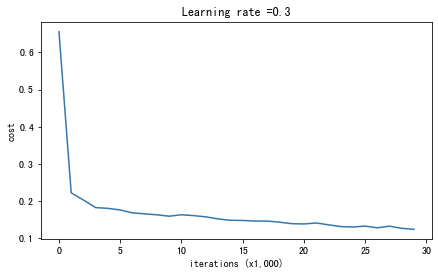
parameters = model(train_X, train_Y,is_plot=True)
print("训练集:")
predictions_train = reg_utils.predict(train_X, train_Y, parameters)
print("测试集:")
predictions_test = reg_utils.predict(test_X, test_Y, parameters)
第0次迭代,成本值为:0.6557412523481002
第10000次迭代,成本值为:0.16329987525724213
第20000次迭代,成本值为:0.1385164242325368
训练集:
Accuracy: 0.9478672985781991
测试集:
Accuracy: 0.915
plt.title("Model without regularization")
axes = plt.gca()
axes.set_xlim([-0.75,0.40])
axes.set_ylim([-0.75,0.65])
reg_utils.plot_decision_boundary(lambda x: reg_utils.predict_dec(parameters, x.T), train_X, train_Y)
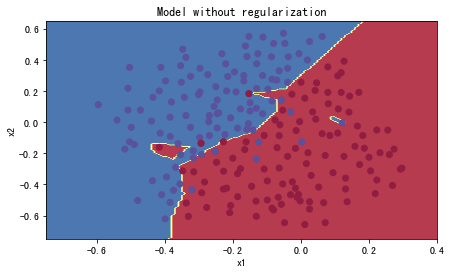
在无正则化时,分割曲线有了明显的过拟合特性
L2 Regularization
The standard way to avoid overfitting is called L2 regularization. It consists of appropriately modifying your cost function.

To calculate L2 regularization cost , use :
np.sum(np.square(Wl))
def compute_cost_with_regularization(A3, Y, parameters, lambd):
    """
    Implement the cost function with L2 regularization. See formula (2) above.

    Arguments:
    A3 -- post-activation, output of forward propagation, of shape (output size, number of examples)
    Y -- "true" labels vector, of shape (output size, number of examples)
    parameters -- python dictionary containing parameters of the model

    Returns:
    cost - value of the regularized loss function (formula (2))
    """
    m = Y.shape[1]
    W1 = parameters["W1"]
    W2 = parameters["W2"]
    W3 = parameters["W3"]

    cross_entropy_cost = reg_utils.compute_cost(A3,Y)

    L2_regularization_cost = lambd * (np.sum(np.square(W1)) + np.sum(np.square(W2))  + np.sum(np.square(W3))) / (2 * m)

    cost = cross_entropy_cost + L2_regularization_cost

    return cost
def backward_propagation_with_regularization(X, Y, cache, lambd):
    """
    Implements the backward propagation of our baseline model to which we added an L2 regularization.

    Arguments:
    X -- input dataset, of shape (input size, number of examples)
    Y -- "true" labels vector, of shape (output size, number of examples)
    cache -- cache output from forward_propagation()
    lambd -- regularization hyperparameter, scalar

    Returns:
    gradients -- A dictionary with the gradients with respect to each parameter, activation and pre-activation variables
    """
    m = X.shape[1]

    (Z1, A1, W1, b1, Z2, A2, W2, b2, Z3, A3, W3, b3) = cache

    dZ3 = A3 - Y

    dW3 = (1 / m) * np.dot(dZ3,A2.T) + ((lambd * W3) / m )
    db3 = (1 / m) * np.sum(dZ3,axis=1,keepdims=True)

    dA2 = np.dot(W3.T,dZ3)
    dZ2 = np.multiply(dA2,np.int64(A2 > 0))
    dW2 = (1 / m) * np.dot(dZ2,A1.T) + ((lambd * W2) / m)
    db2 = (1 / m) * np.sum(dZ2,axis=1,keepdims=True)

    dA1 = np.dot(W2.T,dZ2)
    dZ1 = np.multiply(dA1,np.int64(A1 > 0))
    dW1 = (1 / m) * np.dot(dZ1,X.T) + ((lambd * W1) / m)
    db1 = (1 / m) * np.sum(dZ1,axis=1,keepdims=True)

    gradients = {"dZ3": dZ3, "dW3": dW3, "db3": db3, "dA2": dA2,
                 "dZ2": dZ2, "dW2": dW2, "db2": db2, "dA1": dA1,
                 "dZ1": dZ1, "dW1": dW1, "db1": db1}

    return gradients
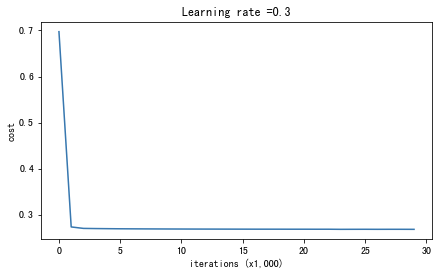
parameters = model(train_X, train_Y, lambd=0.7,is_plot=True)
print("使用正则化,训练集:")
predictions_train = reg_utils.predict(train_X, train_Y, parameters)
print("使用正则化,测试集:")
predictions_test = reg_utils.predict(test_X, test_Y, parameters)
第0次迭代,成本值为:0.6974484493131264
第10000次迭代,成本值为:0.2684918873282239
第20000次迭代,成本值为:0.26809163371273004
使用正则化,训练集:
Accuracy: 0.9383886255924171
使用正则化,测试集:
Accuracy: 0.93
plt.title("Model with L2-regularization")
axes = plt.gca()
axes.set_xlim([-0.75,0.40])
axes.set_ylim([-0.75,0.65])
reg_utils.plot_decision_boundary(lambda x: reg_utils.predict_dec(parameters, x.T), train_X, train_Y)
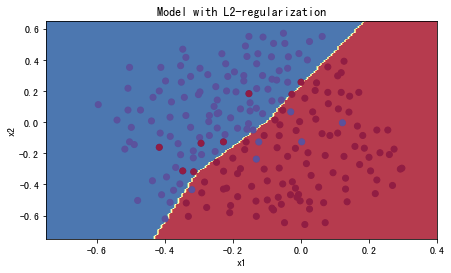
L2正则化对以下内容有影响:
- 成本计算:正则化的计算需要添加到成本函数中
- 反向传播:在权重矩阵方面,梯度计算时也要依据正则化来做出相应的计算
- 重量变小(“重量衰减”):权重被逐渐改变到较小的值
Dropout
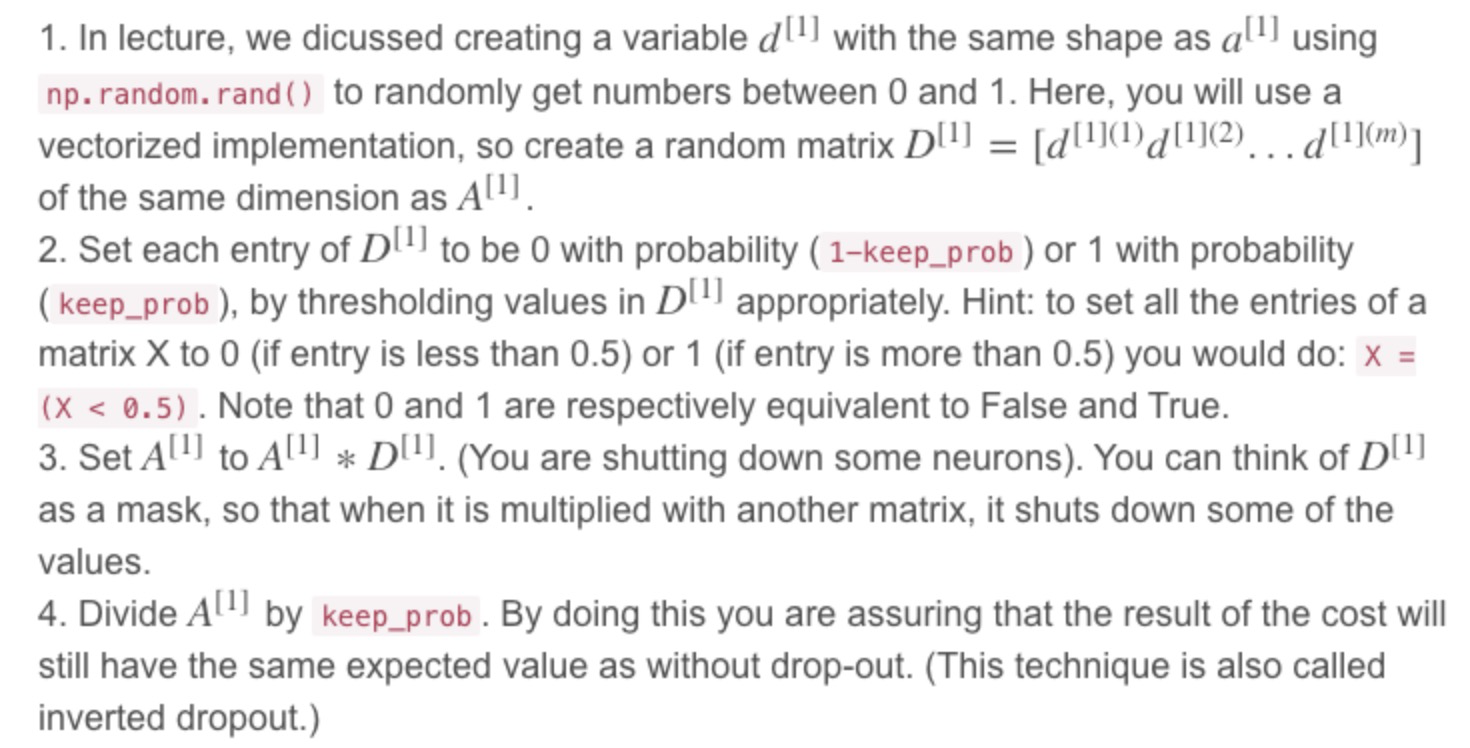
Dropout的原理就是每次迭代过程中随机将其中的一些节点失效。当我们关闭一些节点时,我们实际上修改了我们的模型。背后的想法是,在每次迭代时,我们都会训练一个只使用一部分神经元的不同模型。随着迭代次数的增加,我们的模型的节点会对其他特定节点的激活变得不那么敏感,因为其他节点可能在任何时候会失效。
def forward_propagation_with_dropout(X, parameters, keep_prob = 0.5):
    """
    Implements the forward propagation: LINEAR -> RELU + DROPOUT -> LINEAR -> RELU + DROPOUT -> LINEAR -> SIGMOID.

    Arguments:
    X -- input dataset, of shape (2, number of examples)
    parameters -- python dictionary containing your parameters "W1", "b1", "W2", "b2", "W3", "b3":
                    W1 -- weight matrix of shape (20, 2)
                    b1 -- bias vector of shape (20, 1)
                    W2 -- weight matrix of shape (3, 20)
                    b2 -- bias vector of shape (3, 1)
                    W3 -- weight matrix of shape (1, 3)
                    b3 -- bias vector of shape (1, 1)
    keep_prob - probability of keeping a neuron active during drop-out, scalar

    Returns:
    A3 -- last activation value, output of the forward propagation, of shape (1,1)
    cache -- tuple, information stored for computing the backward propagation
    """
    np.random.seed(1)

    W1 = parameters["W1"]
    b1 = parameters["b1"]
    W2 = parameters["W2"]
    b2 = parameters["b2"]
    W3 = parameters["W3"]
    b3 = parameters["b3"]

    #LINEAR -> RELU -> LINEAR -> RELU -> LINEAR -> SIGMOID
    Z1 = np.dot(W1,X) + b1
    A1 = reg_utils.relu(Z1)

    #下面的步骤1-4对应于上述的步骤1-4。
    D1 = np.random.rand(A1.shape[0],A1.shape[1])    #步骤1:初始化矩阵D1 = np.random.rand(..., ...)
    D1 = D1 < keep_prob                             #步骤2:将D1的值转换为0或1(使用keep_prob作为阈值)
    A1 = A1 * D1                                    #步骤3:舍弃A1的一些节点(将它的值变为0或False)
    A1 = A1 / keep_prob                             #步骤4:缩放未舍弃的节点(不为0)的值

    Z2 = np.dot(W2,A1) + b2
    A2 = reg_utils.relu(Z2)

    #下面的步骤1-4对应于上述的步骤1-4。
    D2 = np.random.rand(A2.shape[0],A2.shape[1])    #步骤1:初始化矩阵D2 = np.random.rand(..., ...)
    D2 = D2 < keep_prob                             #步骤2:将D2的值转换为0或1(使用keep_prob作为阈值)
    A2 = A2 * D2                                    #步骤3:舍弃A1的一些节点(将它的值变为0或False)
    A2 = A2 / keep_prob                             #步骤4:缩放未舍弃的节点(不为0)的值

    Z3 = np.dot(W3, A2) + b3
    A3 = reg_utils.sigmoid(Z3)

    cache = (Z1, D1, A1, W1, b1, Z2, D2, A2, W2, b2, Z3, A3, W3, b3)

    return A3, cache
改变了前向传播的算法,也需要改变后向传播的算法,使用存储在缓存中的舍弃节点信息添加到第一个和第二个隐藏层:
def backward_propagation_with_dropout(X, Y, cache, keep_prob):
    """
    Implements the backward propagation of our baseline model to which we added dropout.

    Arguments:
    X -- input dataset, of shape (2, number of examples)
    Y -- "true" labels vector, of shape (output size, number of examples)
    cache -- cache output from forward_propagation_with_dropout()
    keep_prob - probability of keeping a neuron active during drop-out, scalar

    Returns:
    gradients -- A dictionary with the gradients with respect to each parameter, activation and pre-activation variables
    """
    m = X.shape[1]
    (Z1, D1, A1, W1, b1, Z2, D2, A2, W2, b2, Z3, A3, W3, b3) = cache

    dZ3 = A3 - Y
    dW3 = (1 / m) * np.dot(dZ3,A2.T)
    db3 = 1. / m * np.sum(dZ3, axis=1, keepdims=True)
    dA2 = np.dot(W3.T, dZ3)

    dA2 = dA2 * D2          # 步骤1:使用正向传播期间相同的节点,舍弃那些关闭的节点(因为任何数乘以0或者False都为0或者False)
    dA2 = dA2 / keep_prob   # 步骤2:缩放未舍弃的节点(不为0)的值

    dZ2 = np.multiply(dA2, np.int64(A2 > 0))
    dW2 = 1. / m * np.dot(dZ2, A1.T)
    db2 = 1. / m * np.sum(dZ2, axis=1, keepdims=True)

    dA1 = np.dot(W2.T, dZ2)

    dA1 = dA1 * D1          # 步骤1:使用正向传播期间相同的节点,舍弃那些关闭的节点(因为任何数乘以0或者False都为0或者False)
    dA1 = dA1 / keep_prob   # 步骤2:缩放未舍弃的节点(不为0)的值

    dZ1 = np.multiply(dA1, np.int64(A1 > 0))
    dW1 = 1. / m * np.dot(dZ1, X.T)
    db1 = 1. / m * np.sum(dZ1, axis=1, keepdims=True)

    gradients = {"dZ3": dZ3, "dW3": dW3, "db3": db3,"dA2": dA2,
                 "dZ2": dZ2, "dW2": dW2, "db2": db2, "dA1": dA1,
                 "dZ1": dZ1, "dW1": dW1, "db1": db1}

    return gradients
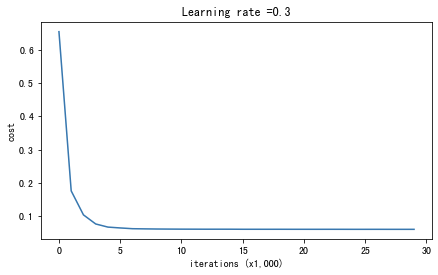
parameters = model(train_X, train_Y, keep_prob=0.86, learning_rate=0.3,is_plot=True)

print("使用随机删除节点,训练集:")
predictions_train = reg_utils.predict(train_X, train_Y, parameters)
print("使用随机删除节点,测试集:")
reg_utils.predictions_test = reg_utils.predict(test_X, test_Y, parameters)
第0次迭代,成本值为:0.6543912405149825


/Users/ldc/Desktop/Project/深度学习wu/reg_utils.py:121: RuntimeWarning: divide by zero encountered in log
  logprobs = np.multiply(-np.log(a3),Y) + np.multiply(-np.log(1 - a3), 1 - Y)
/Users/ldc/Desktop/Project/深度学习wu/reg_utils.py:121: RuntimeWarning: invalid value encountered in multiply
  logprobs = np.multiply(-np.log(a3),Y) + np.multiply(-np.log(1 - a3), 1 - Y)


第10000次迭代,成本值为:0.061016986574905605
第20000次迭代,成本值为:0.060582435798513114
使用随机删除节点,训练集:
Accuracy: 0.9289099526066351
使用随机删除节点,测试集:
Accuracy: 0.95
plt.title("Model with dropout")
axes = plt.gca()
axes.set_xlim([-0.75, 0.40])
axes.set_ylim([-0.75, 0.65])
reg_utils.plot_decision_boundary(lambda x: reg_utils.predict_dec(parameters, x.T), train_X, train_Y)
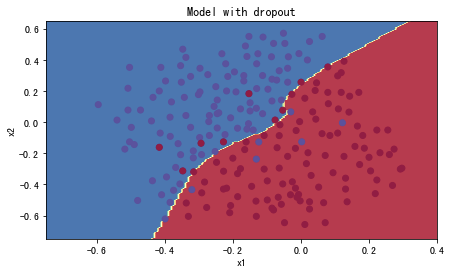
正则化会把训练集的准确度降低,但是测试集的准确度提高了
结论

- Regularization will help you reduce overfitting.
- Regularization will drive your weights to lower values.
- L2 regularization and Dropout are two very effective regularization techniques.
Gradient Checking
一维线性模型的梯度检查计算过程:
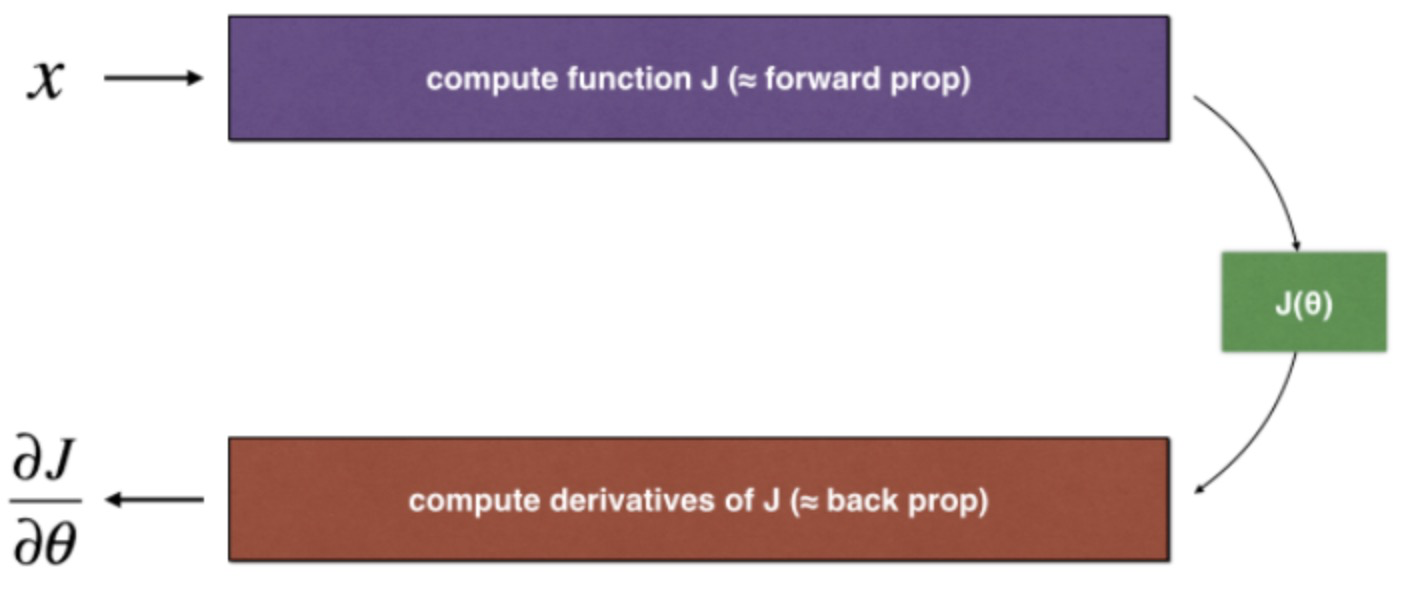
1-dimensional gradient checking
Exercise: implement “forward propagation” and “backward propagation” for this simple function.
def forward_propagation(x, theta):
    """
    Implement the linear forward propagation (compute J) presented in Figure 1 (J(theta) = theta * x)

    Arguments:
    x -- a real-valued input
    theta -- our parameter, a real number as well

    Returns:
    J -- the value of function J, computed using the formula J(theta) = theta * x
    """
    J = np.dot(theta, x)
    return J
x, theta = 2, 4
J = forward_propagation(x, theta)
print ("J = " + str(J))
J = 8
def backward_propagation(x, theta):
    """
    Computes the derivative of J with respect to theta (see Figure 1).

    Arguments:
    x -- a real-valued input
    theta -- our parameter, a real number as well

    Returns:
    dtheta -- the gradient of the cost with respect to theta
    """
    dtheta = x
    return dtheta
x, theta = 2, 4
dtheta = backward_propagation(x, theta)
print ("dtheta = " + str(dtheta))
dtheta = 2
梯度检查
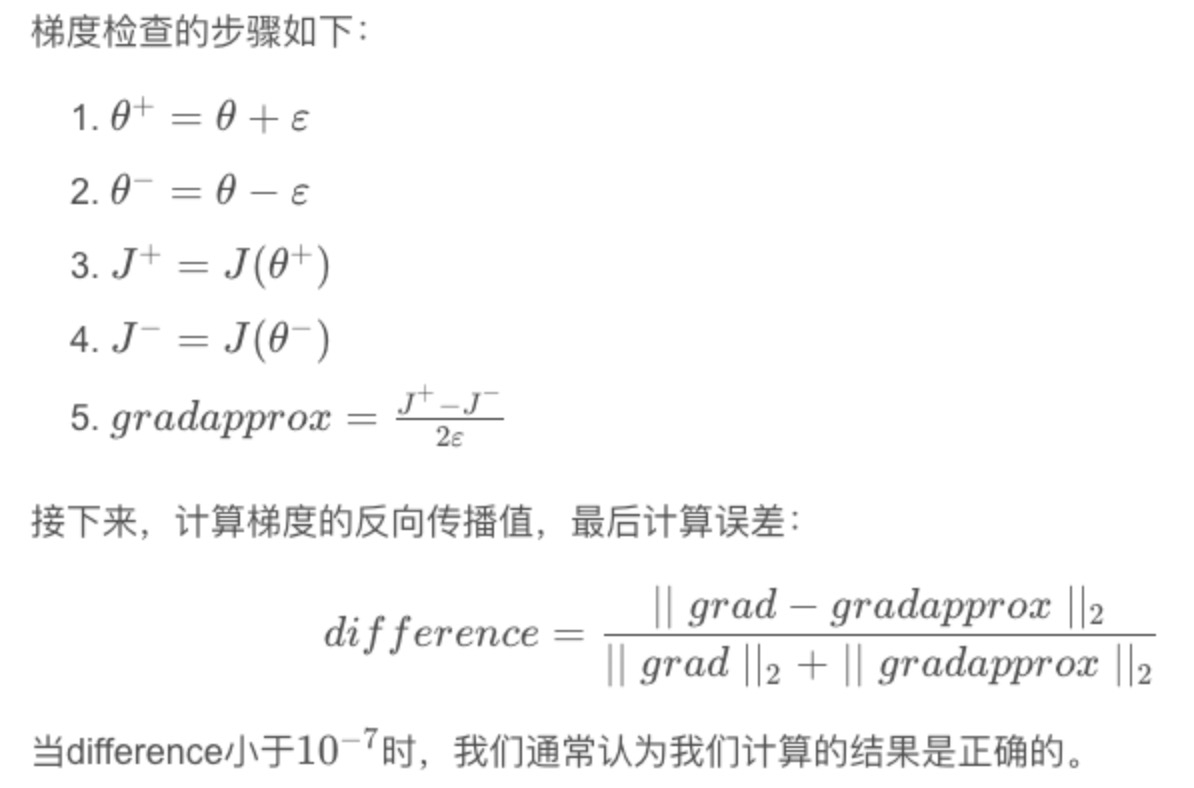
def gradient_check(x, theta, epsilon = 1e-7):
    """
    Implement the backward propagation presented in Figure 1.

    Arguments:
    x -- a real-valued input
    theta -- our parameter, a real number as well
    epsilon -- tiny shift to the input to compute approximated gradient with formula(1)

    Returns:
    difference -- difference (2) between the approximated gradient and the backward propagation gradient
    """
    thetaplus = theta + epsilon
    thetaminus = theta - epsilon
    J_plus = forward_propagation(x, thetaplus)
    J_minus = forward_propagation(x, thetaminus)
    gradapprox = (J_plus - J_minus) / (2 * epsilon)

    grad = backward_propagation(x, theta)

    # numpy.linalg模块包含线性代数的函数。使用这个模块,可以计算逆矩阵、求特征值、解线性方程组以及求解行列式等
    numerator = np.linalg.norm(grad - gradapprox)
    denominator = np.linalg.norm(grad) + np.linalg.norm(gradapprox)
    difference = numerator / denominator

    if difference < 1e-7:
        print ("The gradient is correct!")
    else:
        print ("The gradient is wrong!")

    return difference
x, theta = 2, 4
difference = gradient_check(x, theta)
print("difference = " + str(difference))
The gradient is correct!
difference = 2.919335883291695e-10
N-dimensional gradient checking
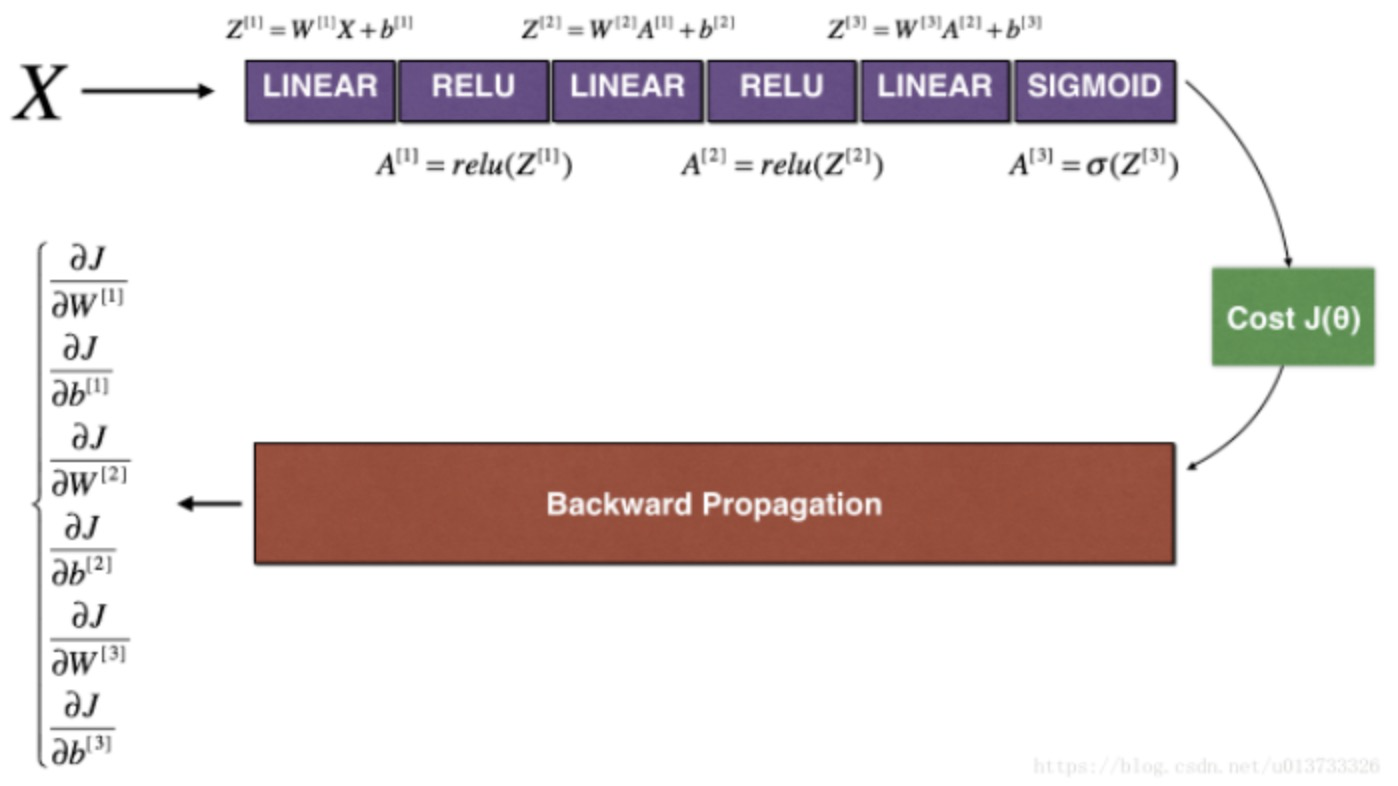
def forward_propagation_n(X, Y, parameters):
    """
    Implements the forward propagation (and computes the cost) presented in Figure 3.

    Arguments:
    X -- training set for m examples
    Y -- labels for m examples
    parameters -- python dictionary containing your parameters "W1", "b1", "W2", "b2", "W3", "b3":
                    W1 -- weight matrix of shape (5, 4)
                    b1 -- bias vector of shape (5, 1)
                    W2 -- weight matrix of shape (3, 5)
                    b2 -- bias vector of shape (3, 1)
                    W3 -- weight matrix of shape (1, 3)
                    b3 -- bias vector of shape (1, 1)

    Returns:
    cost -- the cost function (logistic cost for one example)
    """

    # retrieve parameters
    m = X.shape[1]
    W1 = parameters["W1"]
    b1 = parameters["b1"]
    W2 = parameters["W2"]
    b2 = parameters["b2"]
    W3 = parameters["W3"]
    b3 = parameters["b3"]

    # LINEAR -> RELU -> LINEAR -> RELU -> LINEAR -> SIGMOID
    Z1 = np.dot(W1, X) + b1
    A1 = relu(Z1)
    Z2 = np.dot(W2, A1) + b2
    A2 = relu(Z2)
    Z3 = np.dot(W3, A2) + b3
    A3 = sigmoid(Z3)

    # Cost
    logprobs = np.multiply(-np.log(A3),Y) + np.multiply(-np.log(1 - A3), 1 - Y)
    cost = 1./m * np.sum(logprobs)

    cache = (Z1, A1, W1, b1, Z2, A2, W2, b2, Z3, A3, W3, b3)

    return cost, cache
def backward_propagation_n(X, Y, cache):
    """
    Implement the backward propagation presented in figure 2.

    Arguments:
    X -- input datapoint, of shape (input size, 1)
    Y -- true "label"
    cache -- cache output from forward_propagation_n()

    Returns:
    gradients -- A dictionary with the gradients of the cost with respect to each parameter, activation and pre-activation variables.
    """

    m = X.shape[1]
    (Z1, A1, W1, b1, Z2, A2, W2, b2, Z3, A3, W3, b3) = cache

    dZ3 = A3 - Y
    dW3 = 1./m * np.dot(dZ3, A2.T)
    db3 = 1./m * np.sum(dZ3, axis=1, keepdims = True)

    dA2 = np.dot(W3.T, dZ3)
    dZ2 = np.multiply(dA2, np.int64(A2 > 0))
    dW2 = 1./m * np.dot(dZ2, A1.T)
    db2 = 1./m * np.sum(dZ2, axis=1, keepdims = True)

    dA1 = np.dot(W2.T, dZ2)
    dZ1 = np.multiply(dA1, np.int64(A1 > 0))
    dW1 = 1./m * np.dot(dZ1, X.T)
    db1 = 1./m * np.sum(dZ1, axis=1, keepdims = True)

    gradients = {"dZ3": dZ3, "dW3": dW3, "db3": db3,
                 "dA2": dA2, "dZ2": dZ2, "dW2": dW2, "db2": db2,
                 "dA1": dA1, "dZ1": dZ1, "dW1": dW1, "db1": db1}

    return gradients
def gradient_check_n(parameters,gradients,X,Y,epsilon=1e-7):
    """
    检查backward_propagation_n是否正确计算forward_propagation_n输出的成本梯度

    参数:
        parameters - 包含参数“W1”,“b1”,“W2”,“b2”,“W3”,“b3”的python字典:
        grad_output_propagation_n的输出包含与参数相关的成本梯度。
        x  - 输入数据点,维度为(输入节点数量,1)
        y  - 标签
        epsilon  - 计算输入的微小偏移以计算近似梯度

    返回:
        difference - 近似梯度和后向传播梯度之间的差异
    """
    #初始化参数
    parameters_values , keys = gc_utils.dictionary_to_vector(parameters) #keys用不到
    grad = gc_utils.gradients_to_vector(gradients)
    num_parameters = parameters_values.shape[0]
    J_plus = np.zeros((num_parameters,1))
    J_minus = np.zeros((num_parameters,1))
    gradapprox = np.zeros((num_parameters,1))

    #计算gradapprox
    for i in range(num_parameters):
        #计算J_plus [i]。输入:“parameters_values,epsilon”。输出=“J_plus [i]”
        thetaplus = np.copy(parameters_values)                                                  # Step 1
        thetaplus[i][0] = thetaplus[i][0] + epsilon                                             # Step 2
        J_plus[i], cache = forward_propagation_n(X,Y,gc_utils.vector_to_dictionary(thetaplus))  # Step 3 ,cache用不到

        #计算J_minus [i]。输入:“parameters_values,epsilon”。输出=“J_minus [i]”。
        thetaminus = np.copy(parameters_values)                                                 # Step 1
        thetaminus[i][0] = thetaminus[i][0] - epsilon                                           # Step 2
        J_minus[i], cache = forward_propagation_n(X,Y,gc_utils.vector_to_dictionary(thetaminus))# Step 3 ,cache用不到

        #计算gradapprox[i]
        gradapprox[i] = (J_plus[i] - J_minus[i]) / (2 * epsilon)

    #通过计算差异比较gradapprox和后向传播梯度。
    numerator = np.linalg.norm(grad - gradapprox)                                     # Step 1'
    denominator = np.linalg.norm(grad) + np.linalg.norm(gradapprox)                   # Step 2'
    difference = numerator / denominator                                              # Step 3'

    if difference < 1e-7:
        print("梯度检查:梯度正常!")
    else:
        print("梯度检查:梯度超出阈值!")

    return difference


