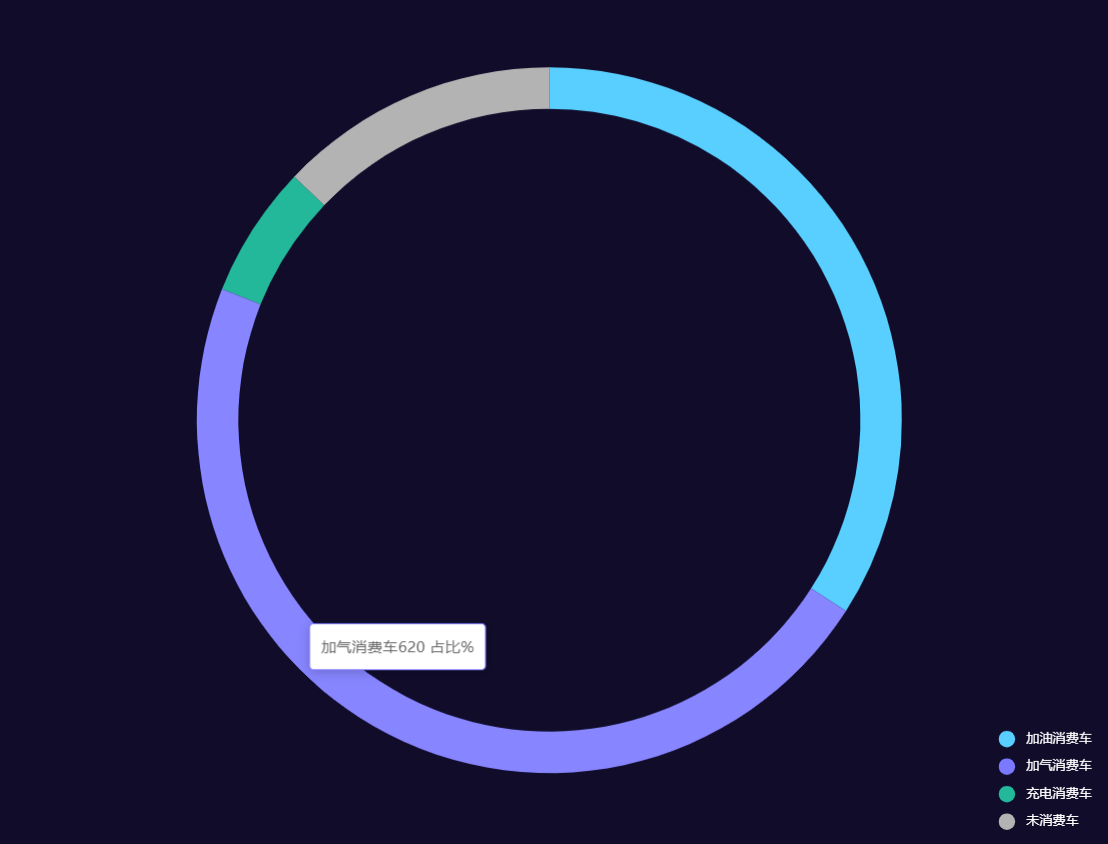
   option = {
        title: {
          text: '',
          textStyle: {
            color: '#17F0E3',
          },
        },
        tooltip: {
          trigger: 'item',
          formatter: function (params) {
            return `${params.name}${params.value}  占比%`
          },
        },
        legend: {
          orient: '', //删除此项图例是水平展示,添加此项图例垂直展示
          x: 'right', //x : 左(left)、右(right)、居中(center)
          y: 'bottom', //y : 上(top)、下(bottom)、居中(center)
          padding: [0, 0, 0, 0], //padding:[0,30,0,0] [(上),(右)、(下)、(左)]

          icon: 'pin',

          textStyle: {
            //图例文字的样式
            color: '#fff',
            fontSize: 12,
          },
          data: ['加油消费车', '加气消费车', '充电消费车', '未消费车'],
        },
        grid: {
          //设置图表撑满整个画布
          top: '12px',
          left: '12px',
          right: '16px',
          bottom: '12px',
          containLabel: true,
        },
        series: [
          {
            hoverAnimation: false, //鼠标悬浮是否有区域弹出动画,false:无  true:有
            name: '',
            type: 'pie',
            radius: ['75%', '85%'], //设置饼图大小宽度
            avoidLabelOverlap: false,
            label: {
              normal: {
                show: false,
                position: 'center',
                formatter: function (data) {
                  // 设置圆饼图中间文字排版
                  return data + '\n' + '车流里总数'
                },
              },
              emphasis: {
                show: false, //文字至于中间时,这里需为true
                textStyle: {
                  //设置文字样式
                  fontSize: '12',
                  color: '#fff',
                },
              },
            },
            emphasis: {
              label: {
                show: true,
                fontSize: '12',
                fontWeight: 'bold',
              },
            },
            labelLine: {
              show: false,
            },
            data: [
              {
                value: 450,
                name: '加油消费车',
                itemStyle: { color: '#59CFFF' },
              },
              {
                value: 620,
                name: '加气消费车',
                itemStyle: { color: '#7B79FF' },
              },
              {
                value: 80,
                name: '充电消费车',
                itemStyle: { color: '#23B89A' },
              },
              { value: 170, name: '未消费车', itemStyle: { color: '#B3B3B3' } },
            ],
          },
        ],
      }


