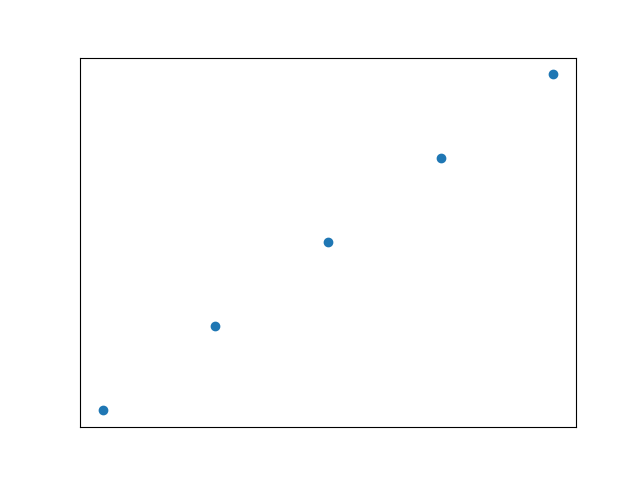
用scatter绘制散点图
from  matplotlib  import  pyplot
import  numpy
n=1024
x=numpy.random.normal(0,1,1024)
y=numpy.random.normal(0,1,1024)
t=numpy.arctan2(x,y)   #代表颜色的数量值

#pyplot.scatter(x,y,s=75,c=t,alpha=0.5)
#pyplot.xlim((-1.5,1.5))
#pyplot.ylim((-1.5,1.5))
pyplot.scatter(numpy.arange(5),numpy.arange(5))


pyplot.xticks(())  #隐藏x坐标
pyplot.yticks(())   #隐藏y坐标


pyplot.show()

 浙公网安备 33010602011771号