2—线性、逻辑回归
线性回归
线性回归通常用于根据连续变量估计实际数值(房价、呼叫次数、总销售额等)。我们通过拟合最佳直线来建立自变量和因变量的关系。这条最佳直线叫做回归线,并且用 Y= a *X + b 这条线性等式来表示。
在这个等式中:
- Y:因变量
- a:斜率
- x:自变量
- b :截距
系数 a 和 b 可以通过最小二乘法获得。
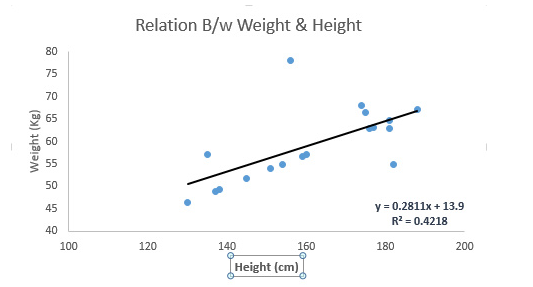
参见下例。我们找出最佳拟合直线 y=0.2811x+13.9。已知人的身高,我们可以通过这条等式求出体重。

线性回归的两种主要类型是一元线性回归和多元线性回归。一元线性回归的特点是只有一个自变量。多元线性回归的特点正如其名,存在多个自变量。找最佳拟合直线的时候,你可以拟合到多项或者曲线回归。这些就被叫做多项或曲线回归。
#Import Library
#Import other necessary libraries like pandas, numpy...
from sklearn import linear_model

#Load Train and Test datasets
#Identify feature and response variable(s) and values must be numeric and numpy arrays
x_train=input_variables_values_training_datasets
y_train=target_variables_values_training_datasets
x_test=input_variables_values_test_datasets

# Create linear regression object
linear = linear_model.LinearRegression()

# Train the model using the training sets and check score
linear.fit(x_train, y_train)
linear.score(x_train, y_train)

#Equation coefficient and Intercept
print('Coefficient: n', linear.coef_)
print('Intercept: n', linear.intercept_)

#Predict Output
predicted= linear.predict(x_test)
逻辑回归
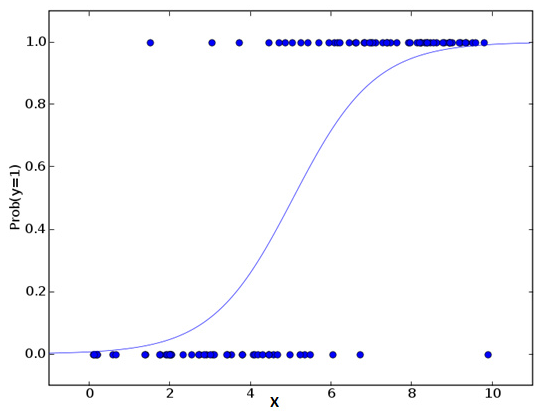
该算法可根据已知的一系列因变量估计离散数值(比方说二进制数值 0 或 1 ,是或否,真或假)。简单来说,它通过将数据拟合进一个逻辑函数来预估一个事件出现的概率。因此,它也被叫做逻辑回归。因为它预估的是概率,所以它的输出值大小在 0 和 1 之间(正如所预计的一样)。
从数学上看,在结果中,几率的对数使用的是预测变量的线性组合模型。
odds= p/ (1-p) = probability of event occurrence / probability of not event occurrence
ln(odds) = ln(p/(1-p))
logit(p) = ln(p/(1-p)) = b0+b1X1+b2X2+b3X3....+bkXk
在上面的式子里,p 是我们感兴趣的特征出现的概率。它选用使观察样本值的可能性最大化的值作为参数,而不是通过计算误差平方和的最小值(就如一般的回归分析用到的一样)。

#Import Library
from sklearn.linear_model import LogisticRegression
#Assumed you have, X (predictor) and Y (target) for training data set and x_test(predictor) of test_dataset
# Create logistic regression object
model = LogisticRegression()

# Train the model using the training sets and check score
model.fit(X, y)
model.score(X, y)

#Equation coefficient and Intercept
print('Coefficient: n', model.coef_)
print('Intercept: n', model.intercept_)

#Predict Output
predicted= model.predict(x_test)
改进点:
- 加入交互项
- 精简模型特性
- 使用正则化方法
- 使用非线性模型
逻辑回归案例:


