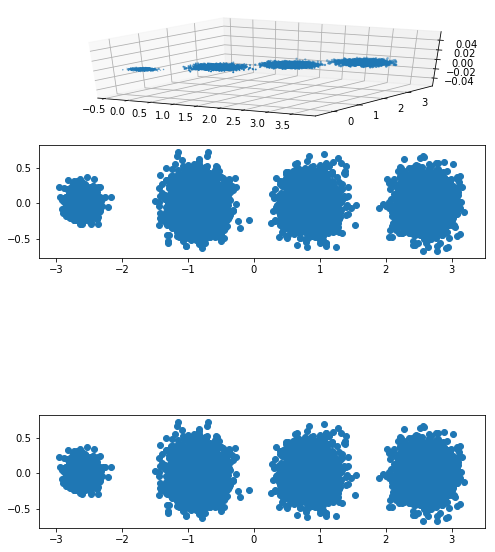
机器学习--用PCA算法实现三维样本降到二维
对于维数比较多的数据,首先需要做的事就是在尽量保证数据本质的前提下将数据中的维数降低。降维是一种数据集预处理技术,往往在数据应用在其他算法之前使用,它可以去除掉数据的一些冗余信息和噪声,使数据变得更加简单高效,从而实现提升数据处理速度的目的,节省大量的时间和成本。降维也成为了应用非常广泛的数据预处理方法。目前处理降维的技术有很多种,如SVD奇异值分解,主成分分析(PCA),因子分析(FA),独立成分分析(ICA)等。
以下是使用主成分分析(PCA)进行降维:
import matplotlib.pyplot as plt
from mpl_toolkits.mplot3d import Axes3D
from sklearn.datasets.samples_generator import make_blobs
from sklearn.decomposition import PCA

def show_scatter(data,nfigure,n_axe):
    num=data.shape[1]
    if num==2:
        fig.add_subplot(nfigure,1,n_axe)
        plt.scatter(data[:,0],data[:,1],marker='o')
    elif num==3:
        fig.add_subplot(nfigure,1,n_axe,projection='3d')
        plt.scatter(data[:,0],data[:,1],data[:,2],marker='o')

def pca_components(component,X):
    if isinstance(component,str):
        pca_n=PCA(n_components=component,svd_solver='full')
        print(component)
    else:
        pca_n=PCA(n_components=component)
        print(component)
    newData_n=pca_n.fit_transform(X)
    print('主成分方差比例:',pca_n.explained_variance_ratio_)
    print('主成分方差:',pca_n.explained_variance_)
    return newData_n

X,y=make_blobs(n_samples=10000,n_features=3,centers=[[3,3,3],
            [0,0,0],[1,1,1],[2,2,2]],cluster_std=[0.2,0.1,0.2,0.2],
    random_state=9)

n_components=[2,0.95,0.99,'mle']


fig=plt.figure(figsize=(8,12) )

show_scatter(X,len(n_components)+1,n_axe=1)

for i,component in zip(range(len(n_components)),n_components):
    newData=pca_components(component,X)
    show_scatter(newData,len(n_components)+1,n_axe=i+2)
输出结果:
2
主成分方差比例: [ 0.98318212  0.00850037]
主成分方差: [ 3.78521638  0.03272613]
0.95
主成分方差比例: [ 0.98318212]
主成分方差: [ 3.78521638]
0.99
主成分方差比例: [ 0.98318212  0.00850037]
主成分方差: [ 3.78521638  0.03272613]
mle
主成分方差比例: [ 0.98318212]
主成分方差: [ 3.78521638]


