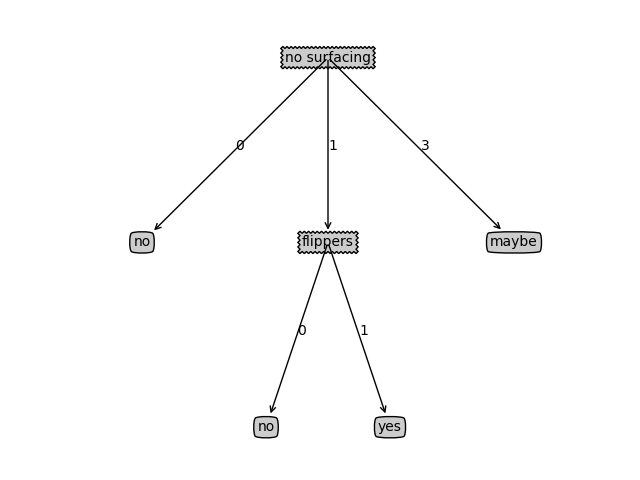
决策树-程序清单3-7
项目将会全部上传至https://github.com/lpzju/machine-learning-in-action-python3
因在自己实践过程中,是拆分成一个一个文件并自己实现,所以可能会出现导包错误问题,文件可在git链接找到,也会尽量把用到的文件先放出
对于程序清单3-7,花了快1天时间,下面将详细讲解思路及实现
首先放出等会要导包文件:getNodesNum
def getNumLeafs(myTree):
    # 首先得到根节点
    # firstNode = myTree.keys()[0]
    # 不能直接对keys进行索引,需先转化成list
    firstNode = list(myTree.keys())[0]
    # print(firstNode)
    # 得到no surfacing
    # 获得根节点对应的字典
    secondDict = myTree[firstNode]
    # 对这个字典进行遍历,如果里面还有字典那就继续遍历
    numLeafs = 0
    for key in secondDict.keys():
        if type(secondDict[key]) == dict:
            numLeafs += getNumLeafs(secondDict[key])
        else:
            # 如果没有了那么叶节点数量 + 1
            numLeafs += 1
    return numLeafs

def getTreeDepth(myTree):
    # 首先得到根节点
    # firstNode = myTree.keys()[0]
    # 不能直接对keys进行索引,需先转化成list
    firstNode = list(myTree.keys())[0]
    # print(firstNode)
    # 得到no surfacing
    # 获得根节点对应的字典
    secondDict = myTree[firstNode]
    # 对这个字典进行遍历,如果里面还有字典那就继续遍历
    # 树的深度要去掉根节点
    maxDepth = 0
    for key in secondDict.keys():
        if type(secondDict[key]) == dict:
            tempDeth = 1 + getTreeDepth(secondDict[key])
        else:
            tempDeth = 1
        if tempDeth > maxDepth:
            maxDepth = tempDeth
    return maxDepth


def retrieveTree(i):
    listOfTrees = [{'no surfacing':{0:'no',1:{'flippers':{0:'no',1:'yes'}}}}, \
                  {'no surfacing': {0: 'no', 1: {'flippers': {0: {'head':{0:'no',1:'yes'}},1:'no'}}}}]
    return listOfTrees[i]

if __name__ == "__main__":
    myTree = retrieveTree(0)
    print(getTreeDepth(myTree))
    print(getNumLeafs(myTree))
    getNumLeafs(myTree)
    # getTreeDepth(myTree)
这个文件中主要有两个函数,一个是获得叶子节点的数目,一个是获得树的深度
首先说一下对于程序清单3-7该怎么阅读并理解:
- 先大致明白其中3个函数的作用
- 先运行起来,看看画出的图像大致是什么样的(因为等会自己进行调试去看图像变化)
- 手动模拟一下,试想一下运算结果,或者打断点
- 在其中不懂的地方多进行print
然后我们来说明一下各函数,首先plotMidText是对连线进行文字添加,效果类似之前的annotation,然后是createPlot,最后plotTree,注意先看createPlot是因为先调用createPlot。
def createPlot(inTree):
    fig = plt.figure(1, facecolor='white')
    fig.clf()
    axprops = dict(xticks=[], yticks=[])
    createPlot.ax1 = plt.subplot(111, frameon=False, **axprops)
    plotTree.totalD = float(gnn.getTreeDepth(inTree))
    plotTree.totalW = float(gnn.getNumLeafs(inTree))
    plotTree.xOff = -0.5 / plotTree.totalW
    plotTree.yOff = 1.0
    plotTree(inTree, (0.5, 1.0), '')
    plt.show()
axprops是一个字典,并且等会plt.subplot的时候传入进去,这里的效果是刻度标记,可以去掉
然后是totalD,是获得树的深度,第一次是2,第二次是1
totalW是叶子节点个数,第一次是4,第二次是2
xOff和yOff,我们当然可以通过计算得出具体数字,但是代表的意义呢?
这里yOff是每一层的高度,xOff个人认为是叶子节点之间水平方向的间隔的一半

在这里共4个叶子节点,那么-1/4 = -0.125
然后就进入plotTree函数中,传入的参数是这个树的字典形式、根节点坐标和连线上的信息
def plotTree(myTree, parentPt, nodeTxt):
    numLeafs = gnn.getNumLeafs(myTree)
    # 获得叶子数目,这里我用的书上第二个例子,叶子数首先是4,第二次变成2
    print("numLeafs:",numLeafs)
    # 这里没用到深度,但是深度第一次是2,第二次是1
    depth = gnn.getTreeDepth(myTree)
    print("depth",depth)
    firstStr = list(myTree.keys())[0]
    print("firstStr:",firstStr)
    print("xOff:", plotTree.xOff)
    print("plotTree.yOff:",plotTree.yOff)
    centerPt = (plotTree.xOff + (1 + numLeafs) / 2 / plotTree.totalW, plotTree.yOff)
    print("totalW:",plotTree.totalW)
    print("totalD:", plotTree.totalD)
    print("centerPtPt:", centerPt)
    print("parentPt:",parentPt)
    plotMidText(centerPt, parentPt, nodeTxt)
    # 从上面的输出来看,第一次的centerPt和parentPt是同一个位置,第一次调用plotMidText、plotNode没有输出内容
    plotNode(firstStr, centerPt, parentPt, decisionNode)
    secondDict = myTree[firstStr]
    # 下一层的y位置
    plotTree.yOff = plotTree.yOff - 1 / plotTree.totalD
    print("plotTree.yOff:",plotTree.yOff)
    print("--------------------")
    for key in secondDict.keys():
        if type(secondDict[key]) == dict:
            plotTree(secondDict[key], centerPt, str(key))
        else:
            plotTree.xOff = plotTree.xOff + 1 / plotTree.totalW
            plotNode(secondDict[key], (plotTree.xOff, plotTree.yOff), centerPt, leafNode)
            plotMidText((plotTree.xOff, plotTree.yOff), centerPt, str(key))
    plotTree.yOff = plotTree.yOff + 1 / plotTree.totalD
在plotTree函数中,先是获得了根节点信息,然后获得两个坐标点,根据这两个坐标点进行画线(第一次不需要),然后对根节点之后的字典进行递归,如果是字典那么继续plotTree,如果是叶子节点,那么直接画线
全部代码如下
import getNodesNum as gnn
import matplotlib.pyplot as plt

# 这一段之前画图已解释过
decisionNode = dict(boxstyle="sawtooth", fc="0.8")
leafNode = dict(boxstyle="round4", fc="0.8")
arrow_args = dict(arrowstyle="<-")

# 这里传入四个参数,如果去除对齐之类的,可以不要xycoords='axes fraction'、textcoords='axes fraction'、va="center", ha="center"
def plotNode(nodeTxt, centerPt, parentPt, nodeType):
    createPlot.ax1.annotate(nodeTxt, xy=parentPt, xycoords='axes fraction',
                            xytext=centerPt, textcoords='axes fraction',
                            va="center", ha="center", bbox=nodeType, arrowprops=arrow_args)


# matplotlib.pyplot.text(x,y,s,fontdict=None,withdash=False,**kwargs)
# 这里是和annotate很像,主要传入坐标位置和要写的东西
def plotMidText(centerPt, parentPt, txtString):
    # 获取父节点与子节点的中间位置,然后写上数据
    # 这里先减再加而不是直接分别去一半,可以避免溢出,但是也没必要
    xMid = (parentPt[0] - centerPt[0]) / 2.0 + centerPt[0]
    yMid = (parentPt[1] - centerPt[1]) / 2.0 + centerPt[1]
    createPlot.ax1.text(xMid, yMid, txtString)


def plotTree(myTree, parentPt, nodeTxt):
    numLeafs = gnn.getNumLeafs(myTree)
    # 获得叶子数目,这里我用的书上第二个例子,叶子数首先是4,第二次变成2
    print("numLeafs:",numLeafs)
    # 这里没用到深度,但是深度第一次是2,第二次是1
    depth = gnn.getTreeDepth(myTree)
    print("depth",depth)
    firstStr = list(myTree.keys())[0]
    print("firstStr:",firstStr)
    print("xOff:", plotTree.xOff)
    print("plotTree.yOff:",plotTree.yOff)
    centerPt = (plotTree.xOff + (1 + numLeafs) / 2 / plotTree.totalW, plotTree.yOff)
    print("totalW:",plotTree.totalW)
    print("totalD:", plotTree.totalD)
    print("centerPtPt:", centerPt)
    print("parentPt:",parentPt)
    plotMidText(centerPt, parentPt, nodeTxt)
    # 从上面的输出来看,第一次的centerPt和parentPt是同一个位置,第一次调用plotMidText、plotNode没有输出内容
    plotNode(firstStr, centerPt, parentPt, decisionNode)
    secondDict = myTree[firstStr]
    # 下一层的y位置
    plotTree.yOff = plotTree.yOff - 1 / plotTree.totalD
    print("plotTree.yOff:",plotTree.yOff)
    print("--------------------")
    for key in secondDict.keys():
        if type(secondDict[key]) == dict:
            plotTree(secondDict[key], centerPt, str(key))
        else:
            plotTree.xOff = plotTree.xOff + 1 / plotTree.totalW
            plotNode(secondDict[key], (plotTree.xOff, plotTree.yOff), centerPt, leafNode)
            plotMidText((plotTree.xOff, plotTree.yOff), centerPt, str(key))
    plotTree.yOff = plotTree.yOff + 1 / plotTree.totalD


def createPlot(inTree):
    fig = plt.figure(1, facecolor='white')
    fig.clf()
    axprops = dict(xticks=[], yticks=[])
    createPlot.ax1 = plt.subplot(111, frameon=False, **axprops)
    plotTree.totalD = float(gnn.getTreeDepth(inTree))
    plotTree.totalW = float(gnn.getNumLeafs(inTree))
    plotTree.xOff = -0.5 / plotTree.totalW
    plotTree.yOff = 1.0
    plotTree(inTree, (0.5, 1.0), '')
    plt.show()


if __name__ == "__main__":
    myTree = {'no surfacing': {0: 'no', 1: {'flippers': {0: 'no', 1: 'yes'}},3:'maybe'}}
    createPlot(myTree)


