numpy学习笔记Ⅰ
一直被numpy和matplotlib困扰,打算好好学习一下,也是从自己的观点,学对自己帮助最大的部分
主要参考<https: www.runoob.com="" numpy="" numpy-advanced-indexing.html="">
Numpy
numpy主要用于多维数组和矩阵,与matplotlib结合可以达到替代matlab的效果
三个常用的简单构造
import numpy as np
a = np.eye(4)
b = np.ones(4)
c = np.zeros((4,5))
print("a:\n",a)
print("b:\n",b)
print("c:\n",c)

a:
 [[1. 0. 0. 0.]
 [0. 1. 0. 0.]
 [0. 0. 1. 0.]
 [0. 0. 0. 1.]]
b:
 [1. 1. 1. 1.]
c:
 [[0. 0. 0. 0. 0.]
 [0. 0. 0. 0. 0.]
 [0. 0. 0. 0. 0.]
 [0. 0. 0. 0. 0.]]
创建时可以指定最小维度(这个从来没用过)
import numpy as np
a = np.array([1, 2, 3, 4, 5], ndmin =  2)
print(a)

[[1 2 3 4 5]]
看到这有点懵,打印看一下shape
a.shape

(1, 5)

一般我们用的是3个参数,分别是维数、行数、列数
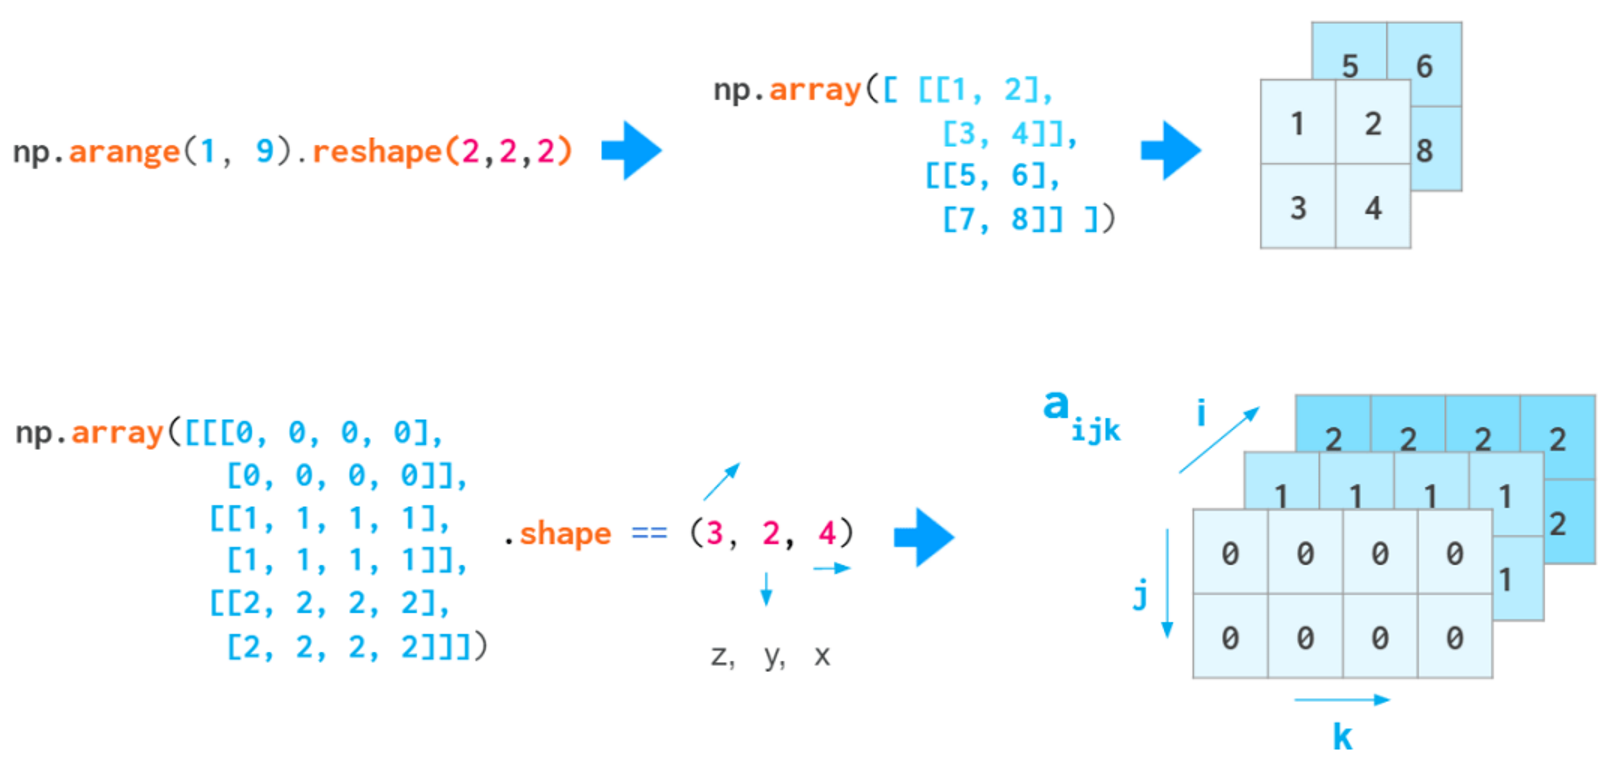
维数:理解为有几个平面,在CNN中理解为多少张图片
这里的(1,5)理解为1行5列但是维数为2
为理解,这里尝试其他组合,如下:
import numpy as np
a = np.array([1, 2, 3, 4, 5], ndmin =  2)
b = np.array([1,2,3,4,5])
c = np.array([[1],[2],[3],[4],[5]])
d = b.reshape(5,-1)
e = b.reshape(5,)
print("a:",a)
print("a.shape:",a.shape)
print("a.ndim:",a.ndim)
print("b:",b)
print("b.shape:",b.shape)
print("b.ndim:",b.ndim)
print("c:",c)
print("c.shape:",c.shape)
print("c.ndim:",c.ndim)
print("d:",d)
print("d.shape:",d.shape)
print("d.ndim:",d.ndim)
print("e:",e)
print("e.shape:",e.shape)
print("e.ndim:",e.ndim)

a: [[1 2 3 4 5]]
a.shape: (1, 5)
a.ndim: 2
b: [1 2 3 4 5]
b.shape: (5,)
b.ndim: 1
c: [[1]
 [2]
 [3]
 [4]
 [5]]
c.shape: (5, 1)
c.ndim: 2
d: [[1]
 [2]
 [3]
 [4]
 [5]]
d.shape: (5, 1)
d.ndim: 2
e: [1 2 3 4 5]
e.shape: (5,)
e.ndim: 1
这样,对于维数,相对来说就理解比较清楚了
np.dtype比较难理解,简单理解就是结构化数据,详细讲解一个例子:
import numpy as np
student = np.dtype([('name','S20'), ('age', 'i1'), ('marks', 'f4')])
a = np.array([('abc', 21, 50),('xyz', 18, 75)], dtype = student)
print(a)
print(a['name'])
print(a['age'])
print(a['marks'])
#print(a.name)

[(b'abc', 21, 50.) (b'xyz', 18, 75.)]
[b'abc' b'xyz']
[21 18]
[50. 75.]
先是创建了一个student结构性数据,其中每个数据第一个元素都是name,S是字符串的意思,第二个元素是age,i1是int8,f是浮点
并且这里数量一定要对应上,比如要使用我们创建的student数据,那么每一条数据里面必须是3个元素,对应的name、age和marks
且虽然这里可以用a['name'],但是不可以使用a.name
numpy.arange(start, stop, step, dtype)
arange函数创建范围数组
np.linspace(start, stop, num=50, endpoint=True, retstep=False, dtype=None)
numpy.linspace 函数用于创建一个一维数组,数组是一个等差数列构成的
numpy的切片
import numpy as np

a = np.array([[1,2,3],[3,4,5],[4,5,6]])
print ("a的第二列:\n",a[...,1])   # 第2列元素
print("a的第二列:\n",a[:,1]) # 第2列元素
print ("a的第二行:\n",a[1,...])   # 第2行元素
print ("a的第二列及后面的列:\n",a[...,1:])  # 第2列及剩下的所有元素

"""
a的第二列:
 [2 4 5]
a的第二列:
 [2 4 5]
a的第二行:
 [3 4 5]
a的第二列及后面的列:
 [[2 3]
 [4 5]
 [5 6]]
"""
这里我们常用的一般还是冒号(我个人喜欢用冒号)
numpy的整数高级索引(真的很无聊)
最主要的是一维一维的去对应
import numpy as np

x = np.array([[1,  2],  [3,  4],  [5,  6]])
y = x[[0,1,2],  [0,1,0]]
print (y)

[1 4 5]
这里就是(0,0)再(1,1)再(2,0)
花式索引默认按照行进行索引
import numpy as np

x=np.arange(32).reshape((8,4))
print (x[[4,2,1,7]])

[[16 17 18 19]
 [ 8  9 10 11]
 [ 4  5  6  7]
 [28 29 30 31]]
多个索引(摇了我吧)
import numpy as np

x=np.arange(32).reshape((8,4))
print (x[np.ix_([1,5,7,2],[0,3,1,2])])

[[ 4  7  5  6]
 [20 23 21 22]
 [28 31 29 30]
 [ 8 11  9 10]]
这里得到了一个这样的矩阵
x[1,0] x[1,3] x[1,1] x[1,2]
x[5,0] x[5,3] x[5,1] x[5,2]
x[7,0] x[7,3] x[7,1] x[7,2]
x[2,0] x[2,3] x[2,1] x[2,2]
nditer创建一个容器,默认按行存储和输出
import numpy as np

a = np.arange(0,60,5)
a = a.reshape(3,4)
print ('原始数组是:')
print (a)
print ('\n')
print ('以 C 风格顺序排序:')
for x in np.nditer(a, order =  'C'):
    print (x, end=", " )
print ('\n')
print ('以 F 风格顺序排序:')
for x in np.nditer(a, order =  'F'):
    print (x, end=", " )

原始数组是:
[[ 0  5 10 15]
 [20 25 30 35]
 [40 45 50 55]]


以 C 风格顺序排序:
0, 5, 10, 15, 20, 25, 30, 35, 40, 45, 50, 55,

以 F 风格顺序排序:
0, 20, 40, 5, 25, 45, 10, 30, 50, 15, 35, 55,
注意,numpy中,默认是按照行进行选取元素,如果想要对每个元素进行遍历,则需要使用flat
import numpy as np

a = np.arange(9).reshape(3,3)
print ('原始数组:')
for row in a:
    print (row)

#对数组中每个元素都进行处理,可以使用flat属性,该属性是一个数组元素迭代器:
print ('迭代后的数组:')
for element in a.flat:
    print (element)

原始数组:
[0 1 2]
[3 4 5]
[6 7 8]
迭代后的数组:
0
1
2
3
4
5
6
7
8
像ravel和flatten,感觉记住reshape就可以了
rollaxis和swapaxis有点难想象,在脑海里画三维然后再把x、y、z轴进行视图转换,感觉一般也比较少用到?
</https:>


