[转]10 More Visual Studio Debugging Tips for Native Development
2013-08-18 10:20 Scott Guthrie Liu 阅读(279) 评论(0) 收藏 举报http://www.codeproject.com/Articles/469416/10-More-Visual-Studio-Debugging-Tips-for-Native-De
I have recently run onto this article by Ivan Shcherbakov called 10+ powerful debugging tricks with Visual Studio. Though the article presents some rather basic tips of debugging with Visual Studio, there are others at least as helpful as those. Therefore I put together a list of ten more debugging tips for native development that work with at least Visual Studio 2008. (If you work with managed code, the debugger has even more features and there are several articles on CodeProject that present them.) Here is my list of additional tips:
- 1. Break on Exception
- 2. Pseudo-variables in Watch Windows
- 3. Watch Heap Objects After Symbol Goes out of Scope
- 4. Watch a Range of Values Inside an Array
- 5. Avoid Stepping into Unwanted Functions
- 6. Launch the debugger from code
- 7. Print to Output Window
- 8. Memory Leaks Isolation
- 9. Debug the Release Build
- 10. Remote Debugging
For more debugging tips check the second article in the series, 10 Even More Visual Studio Debugging Tips for Native Development.
Tip 1: Break on Exception
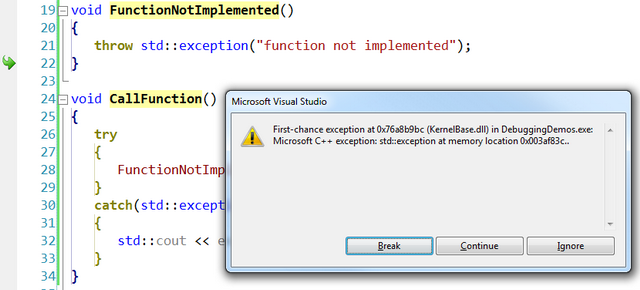
It is possible to instruct the debugger to break when an exception occurs, before a handler is invoked. That allows you to debug your application immediately after the exception occurs. Navigating the Call Stack should allow you to figure the root cause of the exception.
Visual Studio allows you to specify what category or particular exception you want to break on. A dialog is available from Debug > Exceptions menu. You can specify native (or managed) exceptions and aside from the default exceptions known to the debugger, you can add your custom exceptions.
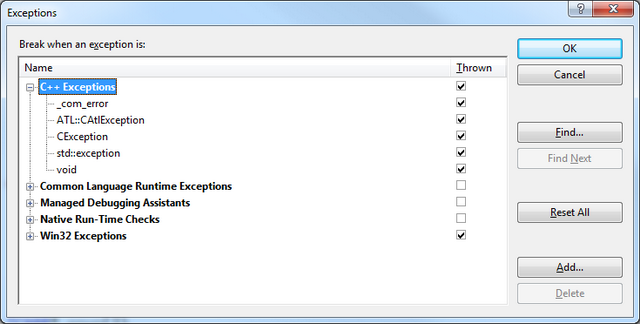
Here is an example with the debugger breaking when a std::exception is thrown.
Additional readings:
Tip 2: Pseudo-variables in Watch Windows
The Watch windows or the QuickWatch dialog support some special (debugger-recognized) variables called pseudovariables. The documented one include:
- $tid – the thread ID of the current thread
- $pid – the process ID
- $cmdline – the command line string that launched the program
- $user – information for the account running the program
- $registername – displays the content of the register registername
However, one that is quite useful is a pseudo-variable for the last error:
- $err – displays the numeric code of the last error
- $err, hr – displays the message of the last error

Additional readings:
Tip 3: Watch Heap Objects After Symbol Goes out of Scope
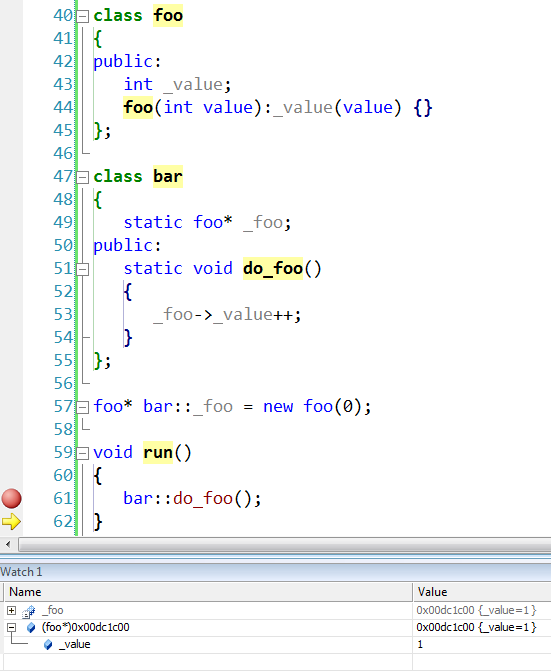
Sometimes you'd like to watch the value of an object (on the heap) even after the symbol goes of scope. When that happens, the variable in the Watch window is disabled and cannot be inspected any more (nor updated) even if the object is still alive and well. It is possible to continue to watch it in full capability if you know the address of the object. You can then cast the address to a pointer of the object type and put that in the Watch window.
In the example bellow, _foo is no longer accessible in the Watch window after stepping out of do_foo(). However, taking its address and casting it to foo* we can still watch the object.
Tip 4: Watch a Range of Values Inside an Array
If you work with large arrays (let say at least some hundred elements, but maybe even less) expanding the array in the Watch window and looking for some particular range of elements is cumbersome, because you have to scroll a lot. And if the array is allocated on the heap you can't even expand its elements in the Watch window. There is a solution for that. You can use the syntax (array + <offset>), <count> to watch a particular range of <count> elements starting at the <offset> position (of course, array here is your actual object). If you want to watch the entire array, you can simply say array, <count>.

If your array is on the heap, then you can expand it in the Watch window, but to watch a particular range you'd have to use a slightly different the syntax: ((T*)array + <offset>), <count> (notice this syntax also works with arrays on the heap). In this case T is the type of the array's elements.

If you work with MFC and use the "array" containers from it, like CArray, CDWordArray, CStringArray, etc., you can of course apply the same filtering, except that you must watch the m_pData member of the array, which is the actual buffer holding the data.

Tip 5: Avoid Stepping into Unwanted Functions
Many times when you debug the code you probably step into functions you would like to step over, whether it's constructors, assignment operators or others. One of those that used to bother me the most was the CStringconstructor. Here is an example when stepping into take_a_string() function first steps into CString's constructor.
void take_a_string(CString const &text)
{
}

void test_string()
{
   take_a_string(_T("sample"));
}

Luckily it is possible to tell the debugger to step over some methods, classes or entire namespaces. The way this was implemented has changed. Back in the days of VS 6 this used to be specified through the autoexp.dat file. Since Visual Studio 2002 this was changed to Registry settings. To enable stepping over functions you need to add some values in Registry (you can find all the details here):
- The actual location depends on the version of Visual Studio you have and the platform of the OS (x86 or x64, because the Registry has to views for 64-bit Windows)
- The value name is a number and represents the priority of the rule; the higher the number the more precedence the rules has over others.
- The value data is a REG_SZ value representing a regular expression that specifies what to filter and what action to perform.
To skip stepping into any CString method I have added the following rule:

Having this enabled, even when you press to step into take_a_string() in the above example the debugger skips the CString's constructor.
Additional readings:
Tip 6: Launch the debugger from code
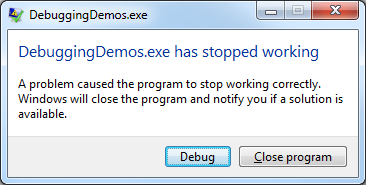
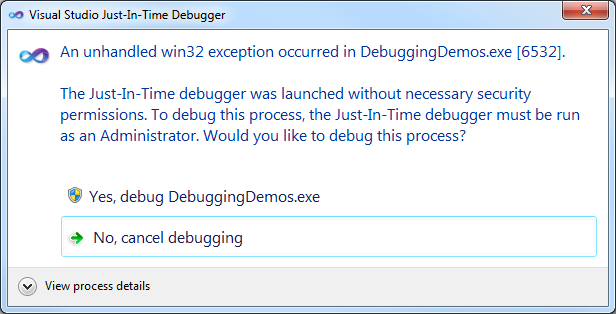
Seldom you might need to attach with the debugger to a program, but you cannot do it with the Attach window (maybe because the break would occur too fast to catch by attaching), nor you can start the program in debugger in the first place. You can cause a break of the program and give the debugger a chance to attach by calling the__debugbreak() intrinsic.
void break_for_debugging()
{
   __debugbreak();
}
There are actually other ways to do this, such as triggering interruption 3, but this only works with x86 platforms (ASM is no longer supported for x64 in C++). There is also a DebugBreak() function, but this is not portable, so the intrinsic is the recommended method.
__asm int 3;
When your program executes the intrinsic it stops, and you get a chance to attach a debugger to the process.

Additional readings:
- __debugbreak intrinsic
- DebugBreak and ASSERTs that work always anywhere
- Debugging with Visual Studio 2005/2008, Part 4: Setting up Code for the Debugger
Tip 7: Print to Output Window
It is possible to show a particular text in the debugger's output window by calling DebugOutputString. If there is no debugger attached, the function does nothing.

Tip 8: Memory Leaks Isolation
Memory leaks are an important problem in native development and finding them could be a serious challenging especially in large projects. Visual Studio provides reports about detected memory leaks and there are other applications (free or commercial) to help you with that. In some situations though, it is possible to use the debugger to break when an allocation that eventually leaks is done. To do this however, you must find a reproducible allocation number (which might not be that easy though). If you are able to do that, then the debugger can break the moment that is performed.
Let's consider this code that allocates 8 bytes, but never releases the allocated memory. Visual Studio displays a report of the leaked objects, and running this several times I could see it's always the same allocation number (341).
void leak_some_memory()
{
   char* buffer = new char[8];
}

Dumping objects ->
d:\marius\vc++\debuggingdemos\debuggingdemos.cpp(103) : {341} normal block at 0x00F71F38, 8 bytes long.
 Data: <        > CD CD CD CD CD CD CD CD
Object dump complete.
The steps for breaking on a particular (reproducible) allocation are:
- Make sure you have the adequate reporting mode for memory leaks (see Finding Memory Leaks Using the CRT Library).
- Run the program several times until you find reproducible allocation numbers ({341} in my example above) in the memory leaks report at the end of running the program.
- Put a breakpoint somewhere at the start of the program so you can break as early as possible.
- Start the application with the debugger.
- When the initial breakpoint is hit, in the watch window write in the Name column:{,,msvcr90d.dll}_crtBreakAlloc, and in Value column put the allocation number that you want to investigate.
- Continue debugging (F5).
- The execution stops at the specified allocation. You can use the Call Stack to navigate back to your code where the allocation was triggered.
Following these steps for my example with allocation number 341 I was able to identify the source of the leak:

Tip 9: Debug the Release Build
Debug and Release builds are meant for different purposes. While a Debug configuration is used for development, a Release configuration, as the name implies should be used for the final version of a program. Since it's supposed that the application meets the required quality to be published, such a configuration contains optimizations and settings that break the debugging experience of a Debug build. Still, sometimes you'd like to be able to debug the Release build the same way you debug the Debug build. To do that, you need to perform some changes in the configuration. However, in this case one could argue you no longer debug the Release build, but rather a mixture of the Debug and the Release builds.

There are several things you should do; the mandatory ones are:
- C/C++ > General > Debug Information Format should be "Program Database (/Zi)"
- C/C++ > Optimization > Optimization should be "Disabled (/Od)"
- Linker > Debugging > Generate Debug Info should be "Yes (/DEBUG)"

Additional readings:
Tip 10: Remote Debugging
Another important debugging experience is remote debugging. This is a larger topic, covered many times, so I just want to summarize a bit.
- You need Remote Debugging Monitor installed on the remote machine
- The Remote Debugging Monitor must run "As Administrator" and the user must be a member of the Administrators group
- When you run the monitor it starts a new server whose name you must use in the Visual Studio's Attach to Progress window in the Qualifier combo.


- The firewalls on the remote and local machine must allow communication between Visual Studio and the Remote Debugging Monitor
- To be able to debug, the PDB files are key; in order for the Visual Studio debugger to be able to load them automatically
- the native PDBs must be available on the local machine (on the same path where the corresponding module is located on the remote machine),
- the managed PDBs must be available on the remote machine.
Remote Debugging Monitor downloads:
Additional readings:
- Setting Up Remote Debugging
- How to: Run the Remote Debugging Monitor
- Loading debug symbols when remote debugging: native vs managed
- PDB Files: What Every Developer Must Know
- Visual Studio Remote Debugging and PDB Files
- How to: Specify Symbol Locations and Loading Behavior
Conclusions
The debugging tips presented in this article and the original article that inspired this one should provide the necessary tips for most of the debugging experiences and problems. To get more information about these tips I suggest following the additional readings.


 浙公网安备 33010602011771号