安装、使用sklearn
安装Anaconda
Anaconda是Python的一个发行版,包含大量科学包(pandas、numpy、scipy...)
https://mirrors.tuna.tsinghua.edu.cn/anaconda/archive/

(如果之前系统已经安装过Python 3.7,再安装Anaconda不会冲突)
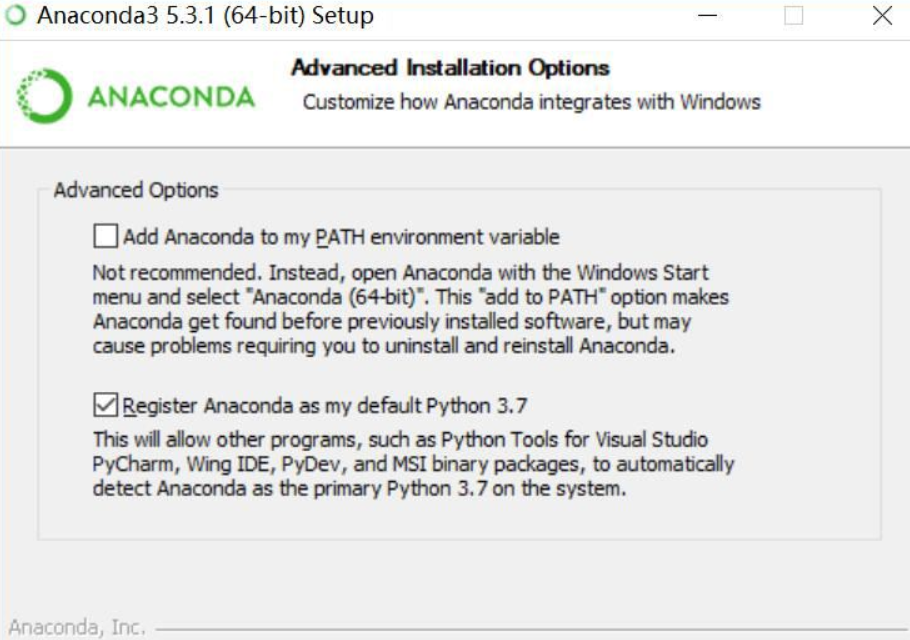
直接一路next,注意这里选择:
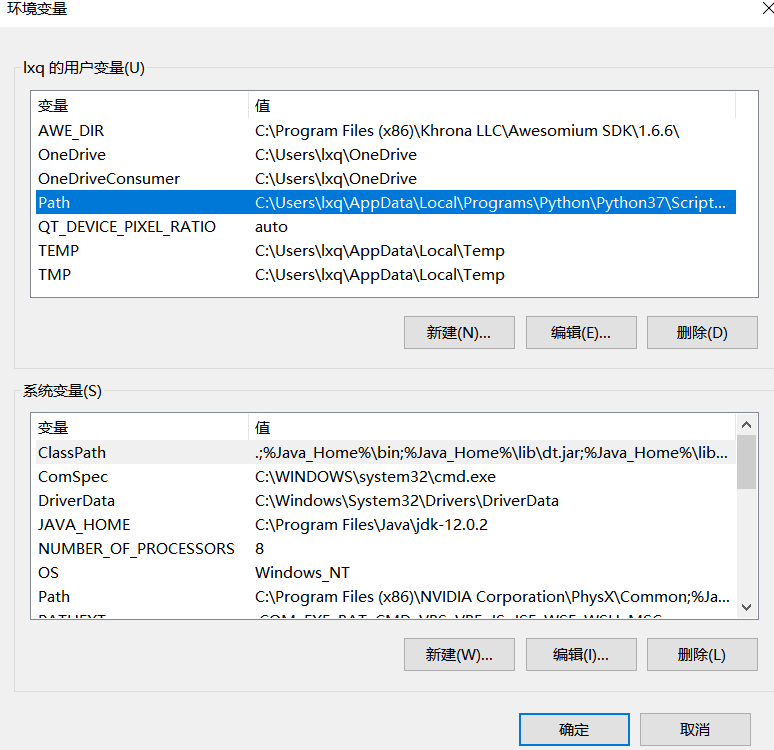
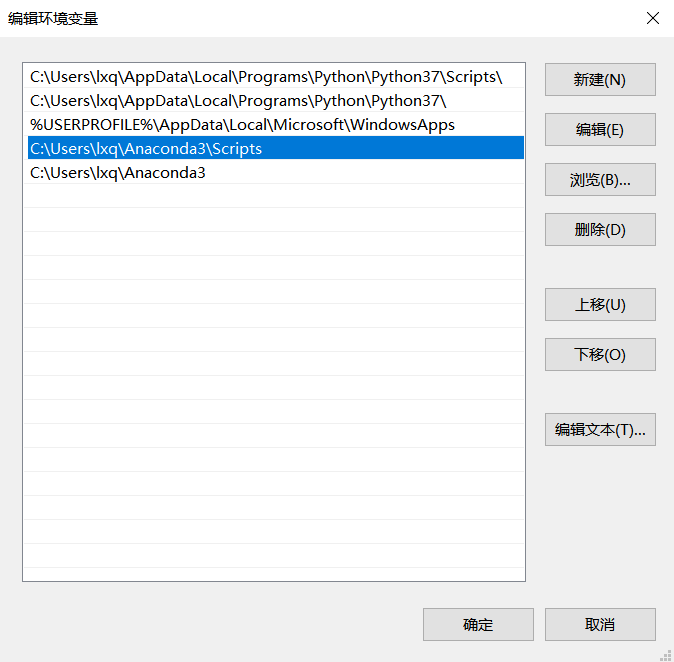
配置环境,在Path中添加Anaconda安装的主目录路径和Anaconda的Scripts目录路径:
最后终端输入命令:conda --version查看是否安装成功
安装成功后可输入命令:conda upgrade --all 将所有工具包升级(也可以不要,很慢)
安装scikit-learn
终端输入命令:conda install scikit-learn

安装PyCharm
选择专业版
https://www.jetbrains.com/zh-cn/pycharm/download/#section=windows
激活码
https://www.cnblogs.com/codehome/p/8342430.html
http://lookdiv.com/
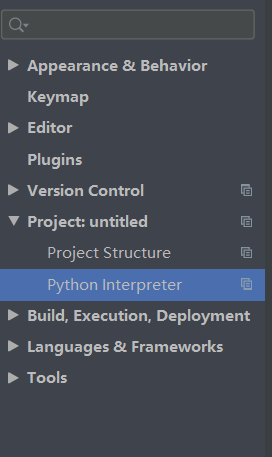
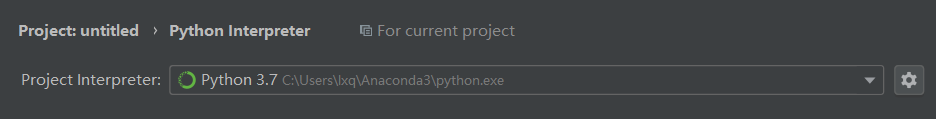
创建项目并配置解释器
File---Settings---Python Interpreter
sklearn简单使用
在项目下新建Python文件
输入代码,run
import matplotlib as mpl
mpl.use('TkAgg')#解决绘图无法显示,不知原理
from sklearn import datasets#引入数据集
#构造的各种参数可以根据自己需要调整
X,y=datasets.make_regression(n_samples=100,n_features=1,n_targets=1,noise=1)
###绘制构造的数据###
import matplotlib.pyplot as plt
plt.figure()
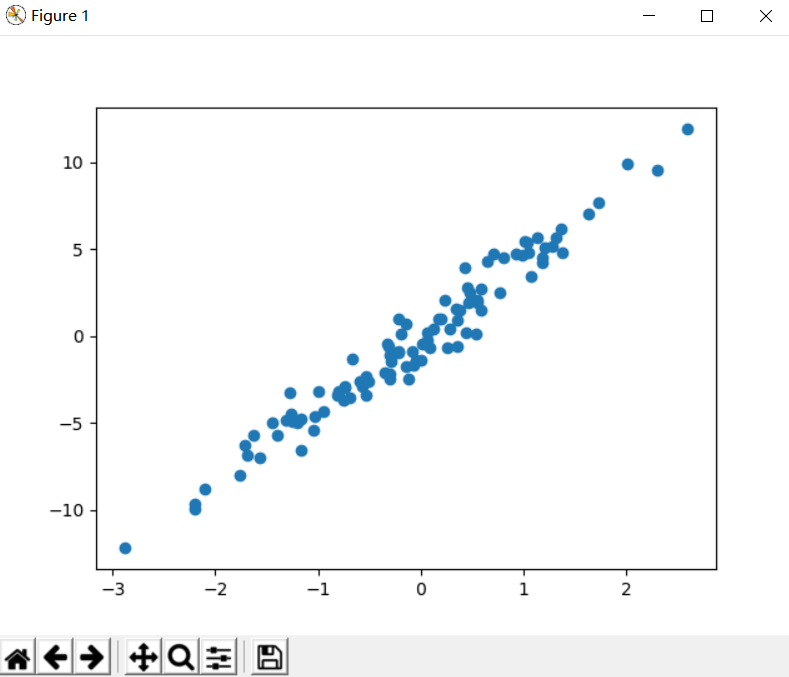
plt.scatter(X,y)
plt.show()
小插曲,绘图无法显示解决办法(也有可能是其他原因):
https://blog.csdn.net/originalcandy/article/details/84996353
https://blog.csdn.net/whtlook/article/details/100061434
运行结果
也可以试试这个,网上随便找的
import matplotlib as mpl
mpl.use('TkAgg')
# Import the necessary modules and libraries
import numpy as np
from sklearn.tree import DecisionTreeRegressor
import matplotlib.pyplot as plt
# Create a random dataset
rng = np.random.RandomState(1)
X = np.sort(5 * rng.rand(80, 1), axis=0)
y = np.sin(X).ravel()
y[::5] += 3 * (0.5 - rng.rand(16))
# Fit regression model
regr_1 = DecisionTreeRegressor(max_depth=2)
regr_2 = DecisionTreeRegressor(max_depth=5)
regr_1.fit(X, y)
regr_2.fit(X, y)
# Predict
X_test = np.arange(0.0, 5.0, 0.01)[:, np.newaxis]
y_1 = regr_1.predict(X_test)
y_2 = regr_2.predict(X_test)
# Plot the results
plt.figure()
plt.scatter(X, y, c="darkorange", label="data")
plt.plot(X_test, y_1, color="cornflowerblue", label="max_depth=2", linewidth=2)
plt.plot(X_test, y_2, color="yellowgreen", label="max_depth=5", linewidth=2)
plt.xlabel("data")
plt.ylabel("target")
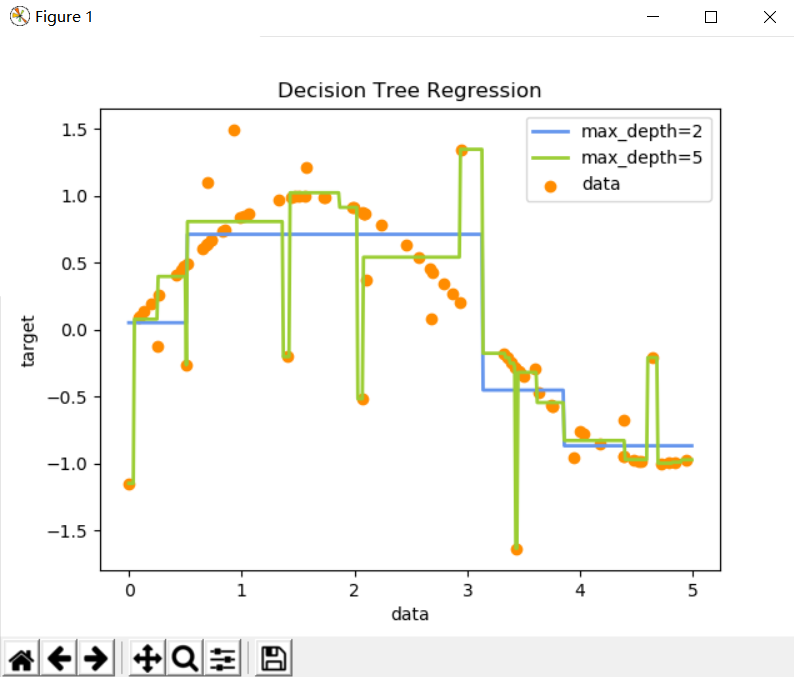
plt.title("Decision Tree Regression")
plt.legend()
plt.show()
运行结果
安装GraphViz和pydotplus(用于可视化决策树)
安装GraphViz
选择msi文件下载并安装
https://graphviz.gitlab.io/_pages/Download/Download_windows.html
安装完成后,将bin目录加入到系统path环境变量中
终端输入命令:conda install python-graphviz即可完成安装python插件graphviz
安装pydotplus
终端输入命令:conda install pydotplus即可完成安装python插件pydotplus
测试代码
也可参考这里的测试代码:https://blog.csdn.net/pilipala6868/article/details/79963650
from sklearn.datasets import load_iris
from sklearn import tree
import pydotplus
iris = load_iris()
clf = tree.DecisionTreeClassifier()
clf = clf.fit(iris.data, iris.target)
dot_data = tree.export_graphviz(clf, out_file=None,
feature_names=iris.feature_names,
class_names=iris.target_names,
filled=True, rounded=True,
special_characters=True)
graph = pydotplus.graph_from_dot_data(dot_data)
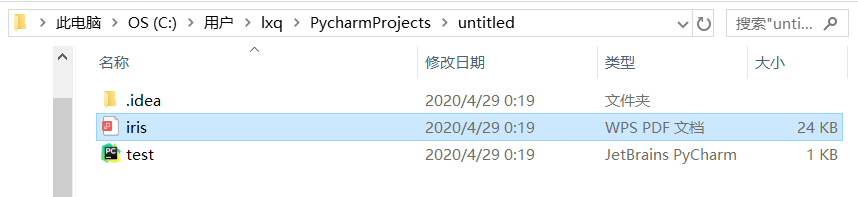
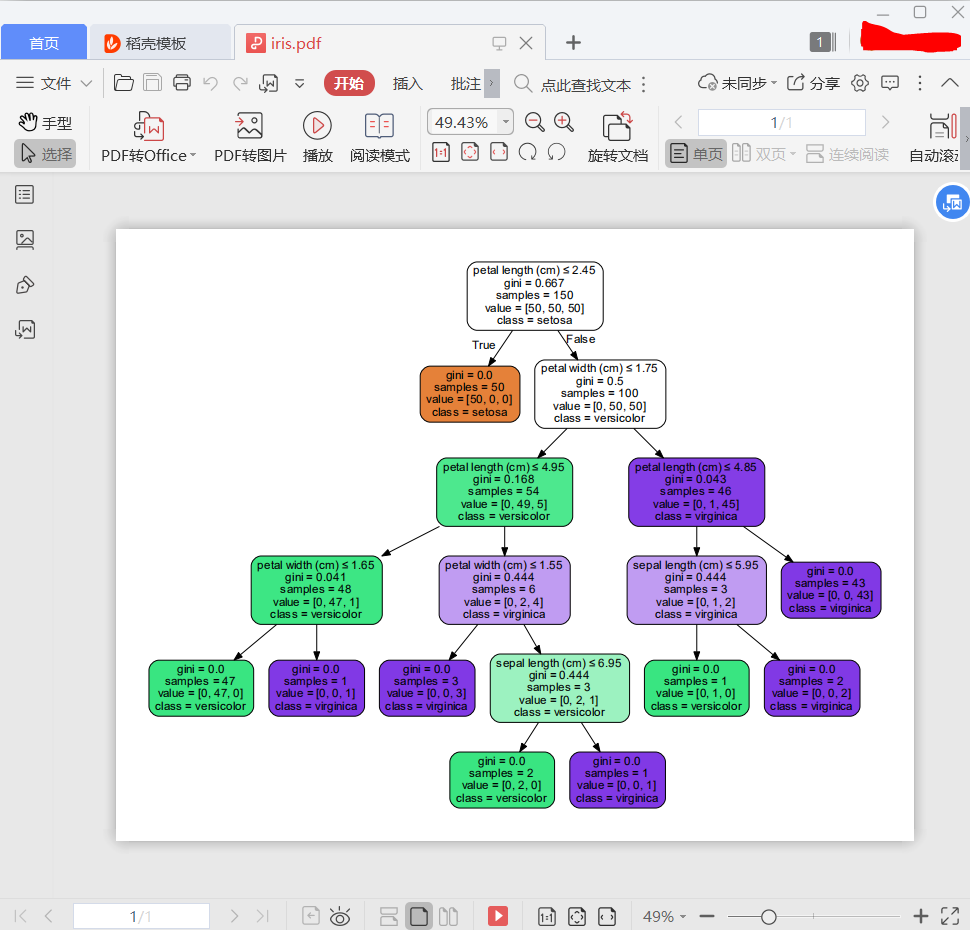
graph.write_pdf('iris.pdf')
运行后,可以看到在项目目录下生成了pdf可视化文件