echart修改tooltip显示样式
formatter: function(params) {
console.log("eeessss")
console.log(params)
var result = "<div>" + params[0].axisValue + "</div>";
params.forEach(function(item, index) {
result +=
'<span style="display:inline-block;margin-right:5px;margin-bottom:2px;border-radius:10px;width:9px;height:9px;+
item.color +
'"></span>';
result += item.seriesName + ":" + (item.data*100).toFixed(2) + "%<br>";
});
return result;
}
},
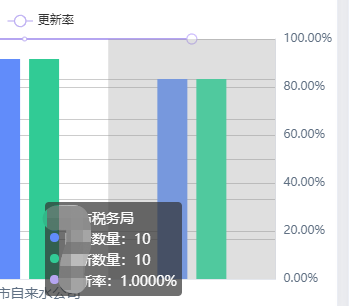
效果:

 浙公网安备 33010602011771号