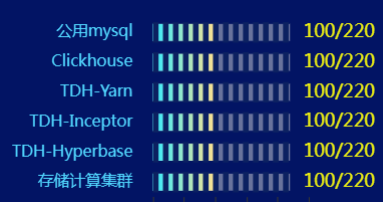
【金融大屏项目】—— Echarts电池效果柱状图(PictorialBar)
barChart组件代码:
import React, { PureComponent } from 'react';
import echarts from 'echarts/lib/echarts';
import 'echarts/lib/chart/bar';
import 'echarts/lib/chart/pictorialBar';
import styles from './index.less';

class BarChart extends PureComponent {
  constructor(props) {
    super(props);
    this.state = {};
  }

  componentDidMount() {
    const { data } = this.props;
    this.initBarChart(data);
    // 窗口改变重新加装定时器并重绘echarts
    window.addEventListener('resize', () => {
      this.initBarChart(data);
    });
  }

  componentDidUpdate() {
    const { data } = this.props;
    // 数据改变重绘echarts
    this.initBarChart(data);
    // 窗口改变重新加装定时器并重绘echarts
    window.addEventListener('resize', () => {
      this.initBarChart(data);
    });
  }

  initBarChart = (data) => {
    if (data && data.name && data.value) {
      const { id } = this.props;
      const myChart = echarts.init(document.getElementById(id));
      const option = {
        // tooltip: {
        //   trigger: 'axis'
        // },
        grid: {
          left: 0,
          right: 69,
          top: 19,
          bottom: 0,
          containLabel: true
        },
        xAxis: {
          type: 'value',
          // boundaryGap: [0, 0.01],
          splitLine:{//去除网格线
            show:false
          },
          axisLine:{//坐标轴线条相关设置(颜色等)
            show: false,
          },
        },
        yAxis: {
          name: '',
          type: 'category',
          // nameTextStyle :{
          //   fontSize: 12,
          //   color: '#ffffff',
          //   padding: [0,0,0,60]
          // },
          axisLine:{//坐标轴线条相关设置(颜色等)
            show: false,
            // lineStyle:{
            //   color:'#ffffff',
            // }
          },
          axisTick: { //不显示刻度线
            show: false
          },
          axisLabel: {
            textStyle: {
              color: '#51D7FF',
              fontSize:14,
              padding: [0, 10, 0, 0]
            },
          },
          data: data.name
        },
        series: [
          {
            type: 'bar',
            itemStyle:{					//---图形形状
              normal: {
                color: new echarts.graphic.LinearGradient(0, 0, 1, 0, [{
                  offset: 0,
                  color: "#34ECFF" // 0% 处的颜色
                }, {
                  offset: 1,
                  color: "#FFE18F" // 100% 处的颜色
                }], false)
              }
            },
            barWidth:15,				//---柱形宽度
            barCategoryGap:14,		//---柱形间距
            data: data.value,
            z: 1,
            zlevel: 2
          },
          {
            type: 'bar',
            barWidth: 15,
            barGap: '-100%',
            data: data.totalValue.map(function (item, index) {
              return {
                value: item,
                realValue: data.value[index],
              };
            }),
            label: {
              show: true,
              position: 'right',
              formatter: function (params) {
                return params.data.realValue + '/' + params.data.value;
              },
              color: '#EDEF13',
              fontSize: 16,
              padding: [0, 0, 0, 7]
            },
            itemStyle: {
              color: '#69739C',
            },
            z: 0,
            zlevel: 1
          },
          {
            // 分隔
            type: 'pictorialBar',
            itemStyle: {
              normal: {
                color: '#0C2161'
              }
            },
            symbol: 'rect',
            symbolRepeat: 'fixed',
            symbolMargin: 2,
            symbolClip: true,
            symbolSize: [5, 18],
            // symbolBoundingData: 100,
            data: data.totalValue,
            width: 2,
            z: 10,
            zlevel: 3
          },
        ]
      };
      myChart.setOption(option);
    }
  };

  render() {
    const { data, id, width, height } = this.props;
    return (
      <div className={styles.contain}>
        <div className={styles.chart} id={id} style={{ width, height }} />
      </div>
    );
  }
}

export default BarChart;

BarChart.defaultProps = {
  id: 'barChart',
  width: '100%',
  height: '100%',
  data: {
    name: ['计算存储集群','Hyperbase','yarn','Inceptor','clickhouse','公用mysql'],
    value: [5, 5, 4, 8, 10, 7],
    totalValue: [12, 12, 13, 10, 11, 9],
  }
};
less代码:
.contain {
  display: flex;
  align-items: center;
  width: 100%;
  height: 100%;

  .chart {
    width: 100%;
    height: 100%;
  }
}
页面中引用组件:
<BarChart id='nodeChart' data={nodeData} />
注:转载请注明出处
越是迷茫、浮躁的时候,保持冷静和耐心,尤为重要

 浙公网安备 33010602011771号