echart的使用
1.原生使用echart
- 引入js文件
    <script  src="~/Content/js/NightNurseBoard/echarts.min.js" charset="utf-8"></script>
    <script  src="~/Content/js/NightNurseBoard/echarts.js" charset="utf-8"></script>
- 页面引用
var alarm_hour = {
};
echarts.init(document.getElementById('alarm_hour')).setOption(alarm_hour);
- 初始化的时候设置大小
echarts.init(document.getElementById('alarm_hour')).resize()
例子

var alarm_hour = {
    tooltip: {
        trigger: 'axis'
    },
    grid: {
        left: '2%',
        right: '7%',
        bottom: '2%',
        top:'20%',
        containLabel: true
    },
    legend: {
        data: ['每小时告警数']
    },
    toolbox: {
        show: true
    },
    calculable: true,
    xAxis: [
        {
            splitLine: {
                show: true
            },
            type: 'category',
            name: '时间',
            // prettier-ignore
            data: ['Jan', 'Feb', 'Mar', 'Apr', 'May', 'Jun', 'Jul', 'Aug', 'Sep', 'Oct', 'Nov', 'Dec', 'Jan', 'Feb', 'Mar', 'Apr', 'May', 'Jun', 'Jul', 'Aug', 'Sep', 'Oct', 'Nov', 'Dec']
        }
    ],
    yAxis: [
        {
            name: '数量',
            type: 'value',
            splitLine: {
                show: true
            }
        }
    ],
    series: [
        {
            name: '每小时告警数',
            type: 'bar',
            itemStyle: {
                color: 'rgb(221,166,71)'
            },
            data: [
                2.0, 4.9, 7.0, 23.2, 25.6, 76.7, 135.6, 162.2, 32.6, 20.0, 6.4, 3.3, 2.0, 4.9, 7.0, 23.2, 25.6, 76.7, 135.6, 162.2, 32.6, 20.0, 6.4, 3.3
            ]
        }
    ]
};

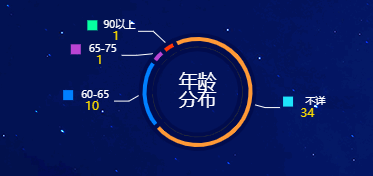
 var ageoption = {
        tooltip: {
            trigger: 'item'
        },
        graphic: [{
            type: 'text',
            left: 'center',
            top: 'middle',
            z: 10,
            style: {
                fill: '#fff',
                text: [
                    '年龄',
                    '分布'
                ].join('\n'),//实现两文本上下换行的效果
                textAlign: 'center',
                font: '1rem Heiti SC red'
            }
        }],
        series: [
            { //内圈
                color: '#21273C',
                name: 'blood1',
                type: 'pie',
                radius: ['48%', '53%'],
                center: ['50%', '50%'], //位置
                minAngle: 15,//最小角度
                startAngle: 220, //起始角度
                itemStyle: {
                    borderColor: 'rgb(1,12,77)',//
                    borderWidth: 4
                },
                label: {
                    show: false,
                    position: 'center'
                },
                data:
                    ageDatan
            },
            {
                name: '年龄分布',
                type: 'pie',
                radius: ['55%', '64%'],
                avoidLabelOverlap: true,
                minAngle: 15,//最小角度
                startAngle: 220, //起始角度
                itemStyle: {
                    borderColor: 'rgb(1,12,77)',//
                    borderWidth: 4
                },
                labelLine: {
                    show: true,//数据标签引导线
                    //length2: 20,
                    position: 'outer',
                    alignTo: 'edge',
                    margin: 10,
                    lineStyle: {
                        color: '#fff',
                    },

                },
                label: {
                    formatter: '{circle|}{circle3|}{b|{b}} \n {circle2|} {c|{c}}  ',
                    rich: {
                        circle: {
                            backgroundColor: '#fff',
                            width: 10,
                            height: 10,
                        },
                        circle2: {
                            width: 10,
                            height: 10,
                        },
                        circle3: {
                            width: 10,
                            height: 10,
                        },//占位
                        b: {
                            color: '#fff',
                            fontSize: 10,
                            width: 24,
                            marginLeft: 14,
                            align: 'center',
                        },
                        c: {
                            color: '#FCDC00',
                            fontSize: 12,
                            width: 24,
                            align: 'left',
                        },
                    },
                },
                data: ageData,
                color: ageColor
            }
        ]
    };
雷达图

var alarm_hour = {
    tooltip: {
        trigger: 'axis'
    },
    grid: {
        left: '2%',
        right: '7%',
        bottom: '2%',
        top:'20%',
        containLabel: true
    },
    legend: {
        data: ['每小时告警数']
    },
    toolbox: {
        show: true
    },
    calculable: true,
    xAxis: [
        {
            splitLine: {
                show: true
            },
            type: 'category',
            name: '时间',
            // prettier-ignore
            data: ['Jan', 'Feb', 'Mar', 'Apr', 'May', 'Jun', 'Jul', 'Aug', 'Sep', 'Oct', 'Nov', 'Dec', 'Jan', 'Feb', 'Mar', 'Apr', 'May', 'Jun', 'Jul', 'Aug', 'Sep', 'Oct', 'Nov', 'Dec']
        }
    ],
    yAxis: [
        {
            name: '数量',
            type: 'value',
            splitLine: {
                show: true
            }
        }
    ],
    series: [
        {
            name: '每小时告警数',
            type: 'bar',
            itemStyle: {
                color: 'rgb(221,166,71)'
            },
            data: [
                2.0, 4.9, 7.0, 23.2, 25.6, 76.7, 135.6, 162.2, 32.6, 20.0, 6.4, 3.3, 2.0, 4.9, 7.0, 23.2, 25.6, 76.7, 135.6, 162.2, 32.6, 20.0, 6.4, 3.3
            ]
        }
    ]
};
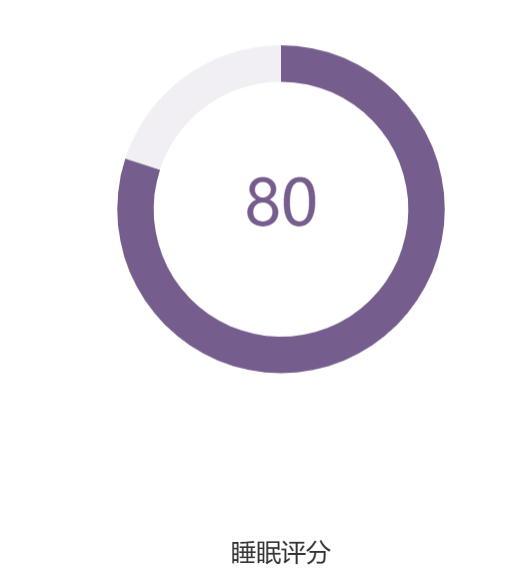
环形进度图

 var e=80;
    option = {
            title:{
                    show:true,
                    text:'睡眠评分',
                    x:'center',
                    y:'bottom',
                    textStyle: {
                        fontSize: '20',
                        color:'#333',
                        fontWeight: 'normal'
                    }
               },
             graphic: [{
            type: 'text',
            left: 'center',
            top:'center',
          //  left:'45%',
            // right:'50%',
            // top: '20%',
            // bottom:'80%',
            z: 10,
            style: {
                fill: 'rgb(117,94,143)',
                text: e,//实现两文本上下换行的效果
                textAlign: 'center',
                fontSize: '50',
                font: '1rem Heiti SC red',
            }
        }],
            tooltip: {
                trigger: 'item',
                formatter: "{d}%",
                show:false
            },
            legend: {
                show:false
            },
            series:
                {
                    name:'睡眠评分',
                    type:'pie',
                    radius: ['70%', '90%'],
                    center: ['50%', '50%'],
                    avoidLabelOverlap: true,
                    hoverAnimation:false,
                  x:'center',
                      y:'center',
                     // position:'top',
              //        bottom:'30px',
                  label: {
                  normal: {
                      show: true,
                  }
              },
                labelLine: {
                    normal: {
                        show: false
                    }
                },
                data:[
                    {value:e, name:''},
                    {value:100-e, name:''}
                ],
                color:['rgb(117,94,143)','rgba(117,94,143,0.1)']
                }
        };
关系图

  var graph = {

      "nodes": [
        {
          "id": "2075956027",
          "name": "作者名字",
          "symbolSize": 19.12381,
          "x": -266.82776,
          "y": 299.6904,
          "value": 28.685715,
          "category": 0,
          "institution": "机构A",
          "paper": "论文1"
        },
        {
          "id": "2128084730",
          "name": "Napoleon",
          "symbolSize": 5,
          "x": -418.08344,
          "y": 446.8853,
          "value": 4,
          "category": 1,
          "institution": "机构A",
          "paper": "论文1"
        },

        {
          "id": "2586982379",
          "name": "MmeMagloire",
          "symbolSize": 6,
          "x": -242.82404,
          "y": 235.26283,
          "value": 9.485714,
          "category": 1,
          "institution": "机构A",
          "paper": "论文1"
        },

        {
          "id": "2575231152",
          "name": "Geborand",
          "symbolSize": 2,
          "x": -417.26337,
          "y": 406.03506,
          "value": 4,
          "category": 2,
          "institution": "机构A",
          "paper": "论文1"
        }

      ],
      "links": [
        {
          "source": "2075956027",
          "target": "2075956027"
        },
        {
          "source": "2128084730",
          "target": "2075956027"
        },
        {
          "source": "2586982379",
          "target": "2075956027"
        },
        {
          "source": "2575231152",
          "target": "2075956027"
        },


      ],
      "categories": [
        {
          "name": ""
        },
        {
          "name": "团队2"
        },
        {
          "name": "团队3"
        },

      ]
    }
    var option = {
      //   tooltip: {
      //     trigger: 'item',
      // },
      tooltip: {
        trigger: 'item', // 触发类型:数据项图形触发
        formatter: function (params) {
          if (params.dataType == "node") {
            return '111'
          } else {
            return ''
          }

          // params 是一个数组,包含了所有触发 tooltip 的系列的数据
          // 需要根据 seriesIndex 来区分节点和边
          // var tooltipStr = '';
          // params.forEach(function (item) {
          //   if (item.seriesType === 'graph' && item.seriesIndex === 0) {
          //     // 节点的 tooltip
          //     tooltipStr = '节点名称: ' + item.name + '<br>节点值: ' + item.value;
          //   } else if (item.seriesType === 'line' && item.seriesIndex === 1) {
          //     // 边的 tooltip
          //     tooltipStr = '边的源节点: ' + item.data.source + '<br>边的目标节点: ' + item.data.target;
          //   }
          // });
          // return tooltipStr;
        }

      },
      legend: [
        {
          data: graph.categories.map(function (a) {
            return a.name;
          })
        }
      ],
      series: [
        {
          name: 'Les Miserables',
          type: 'graph',
          layout: 'none',
          data: graph.nodes,
          links: graph.links,
          categories: graph.categories,
          roam: true,
          label: {
            show: true,
            position: 'top',
            textStyle: {
              fontSize: 10,
              color: '#333'
            },

          },

          labelLayout: {
            hideOverlap: true
          },
          scaleLimit: {
            min: 0.4,
            max: 2
          },
          lineStyle: {
            color: 'source',
            curveness: 0.3
          },

        }
      ]
    };
    echarts.init(document.getElementById('myecharts')).setOption(option);
    echarts.init(document.getElementById('myecharts')).resize()
2.echats属性
折现光滑显示
 series: [{
                        type: 'line',
                        smooth: true,
}]
横坐标滚动条
  xAxis: {
    type: 'category',
    axisLabel: { interval: 0, rotate: 30 }
  },
  dataZoom:[
    {
      show: true,
      start: 0,
      end: 50
    }
  ],
横坐标轴位置,不要再0刻度线
xAxis: {
                        type: 'category',
                        name:"Time(S)",
                        boundaryGap: false,
                        data: result.xAxisArry,
                        axisLine: {
                            onZero: false    //-----------重点
                        }
                    },
显示、隐藏坐标轴,刻度线
 yAxis: {
                        type: 'value',
                        name: '次',
                           axisLine:{     //坐标轴
                            "show":true
                        },
                        axisTick: {        //x轴刻度线
                            show:true
                        },
                    },
想要鼠标移到节点触发提示框,移到边不触发提示框
 tooltip: {
                        trigger: 'item', // 触发类型:数据项图形触发
                        position: function (point, params, dom, rect, size) {
                            // point 是鼠标位置
                            var x = point[0] - 300; // 将tooltip放在鼠标左侧,减去100像素
                            var y = point[1] - 100; // Y坐标保持不变
                            return [x, y]; // 返回tooltip的位置
                        },
                        formatter: function (params) {
                            if (params.dataType == "node") {
                                var institution = params.data.institution; // 机构信息
                                var paper = params.data.paper; // 论文信息
                                return `<div style="display:block;max-width: 300px;word-break: break-all;word-wrap: break-word;white-space:pre-wrap">单位:${institution}  <br>论文:${paper}</div>`;
                            } else {
                                return ""
                            }
                        }
                    },
3.遇到过的问题
- 写了自适应,在别的页面缩放页面,在回到本页面,echarts不自适应或者图标消失
echart所在的div需要写宽度和高度
4.echart自适应
- vue里自适应
   window.addEventListener("resize", function () {
                    yjsjMonthChart.resize();
                });
- 原生自适应
 (function (win, doc) {
        var fres = function () {
            var html = doc.documentElement;
            var w = html.clientWidth;
            w && (html.style.fontSize = (w / 100) + "px"); //显示器31.9467 本机44.7467// fontsize设置成1/100大
            if (!$('#mode_xinxi1').is(":hidden")) {
                smlaChart.resize();
                pingfenChart.resize();
                ChartsResizes();
                //tempChart.resize();
            }
        }
        if (document.readyState === 'complete') {
            fres();
        } else {
            document.addEventListener('DOMContentLoaded', fres, false);
        }
        $.loading(false)
        window.addEventListener('resize', fres, false);
        $("#box").show()
    })(window, document) //自适应 √
5.vue使用echart
mian.js
import * as echarts from 'echarts';
Vue.prototype.$echarts = echarts;
  let yjsjMonthChart = This.$echarts.init(document.getElementById('yjsjMonthChart'), 'macarons');
                yjsjMonthChart.clear();
                yjsjMonthChart.setOption(option);
                window.addEventListener("resize", function () {
                    yjsjMonthChart.resize();
                });
6.highchart演示
highcharts.com.cn/demo/highcharts#3d
7.不同高度的3d饼图
8.精选30个炫酷的数据可视化大屏(含源码),拿走就用!
精选30个炫酷的数据可视化大屏(含源码),拿走就用! (qq.com)


.JPG)

【推荐】国内首个AI IDE,深度理解中文开发场景,立即下载体验Trae
【推荐】编程新体验,更懂你的AI,立即体验豆包MarsCode编程助手
【推荐】抖音旗下AI助手豆包,你的智能百科全书,全免费不限次数
【推荐】轻量又高性能的 SSH 工具 IShell:AI 加持,快人一步
· 无需6万激活码!GitHub神秘组织3小时极速复刻Manus,手把手教你使用OpenManus搭建本
· Manus爆火,是硬核还是营销?
· 终于写完轮子一部分:tcp代理 了,记录一下
· 别再用vector<bool>了!Google高级工程师:这可能是STL最大的设计失误
· 单元测试从入门到精通