基于Streamlit制作的时间序列数据分析APP
基于Streamlit制作的时间序列数据分析APP
1.为什么要使用Streamlit( 官网介绍链接 )
在数据科学领域,一方面,当我们在学习或者实践机器学习算法的时候,需要进行一些参数调整;另一方面,我们也希望将最后的成果通过一种友好的可视化效果呈现出来。
虽然可以通过Django、Flask等技术构建Web App,但是它们对于非专业的编程者来说,初学是困难的。
Streamlit是一种快速搭建数据可视化APP的技术 。它上手简单,并且能够提供一些操作简单的交互式控件。
2.Streamlit使用简介( [ 官网使用教程
](https://docs.streamlit.io/en/stable/index.html) )
2.1 安装和使用
安装 :pip install streamlit
import streamlit as st
Step 1 :新建一个app.py文件
Step 2 :写下一段代码
Step 3 :在终端输入命令:streamlit run app.py
Step 4 :然后会在我们的默认浏览器中自动打开一个网址,呈现刚刚编程的内容
2.2 常用API介绍( 官方API参考文档
)
官网上有详细的介绍,在这里仅简单列举一些。
2.2.1 文本显示命令
    st.text('Fixed width text')
    st.markdown('_Markdown_')
    st.latex(r''' e^{i\pi} + 1 = 0 ''')
    st.write('Most objects')
    st.write(['st', 'is <', 3])
    st.title('My title')
    st.header('My header')
    st.subheader('My sub')
    st.code('for i in range(8): foo()')
    * optional kwarg unsafe_allow_html = True
2.2.2 数据显示命令
    st.dataframe(my_dataframe)
    st.table(data.iloc[0:10])
    st.json({'foo':'bar','fu':'ba'})
2.2.3 图表显示命令
    st.line_chart(data)
    st.area_chart(data)
    st.bar_chart(data)
    st.pyplot(fig)
    st.altair_chart(data)
    st.vega_lite_chart(data)
    st.plotly_chart(data)
    st.bokeh_chart(data)
    st.pydeck_chart(data)
    st.deck_gl_chart(data)
    st.graphviz_chart(data)
    st.map(data)
2.2.4 交互控件显示命令
    st.button('Hit me')
    st.checkbox('Check me out')
    st.radio('Radio', [1,2,3])
    st.selectbox('Select', [1,2,3])
    st.multiselect('Multiselect', [1,2,3])
    st.slider('Slide me', min_value=0, max_value=10)
    st.select_slider('Slide to select', options=[1,'2'])
    st.text_input('Enter some text')
    st.number_input('Enter a number')
    st.text_area('Area for textual entry')
    st.date_input('Date input')
    st.time_input('Time entry')
    st.file_uploader('File uploader')
    st.color_picker('Pick a color')
3.结合实例
因为之前在学习和实践 [ 基于时间序列的机器学习预测分析方法
](https://blog.csdn.net/Be_racle/article/details/112999853)
,这里的例子正是在前面几篇博客基础上写的。实现得比较简单,仅供参考。
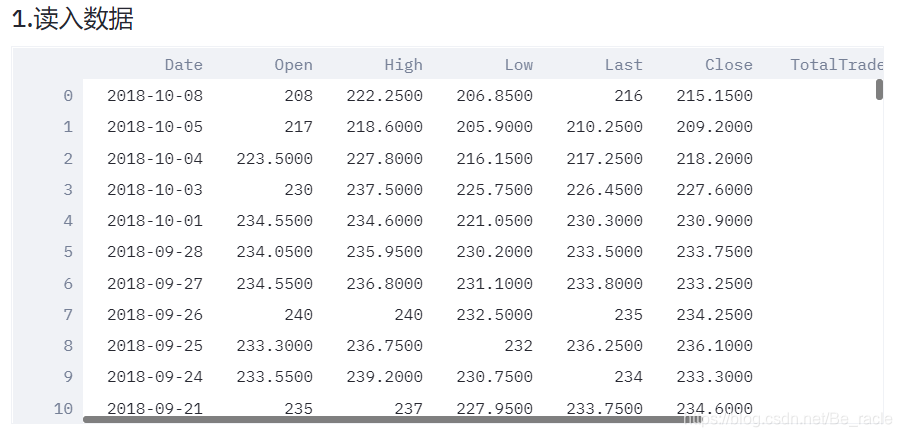
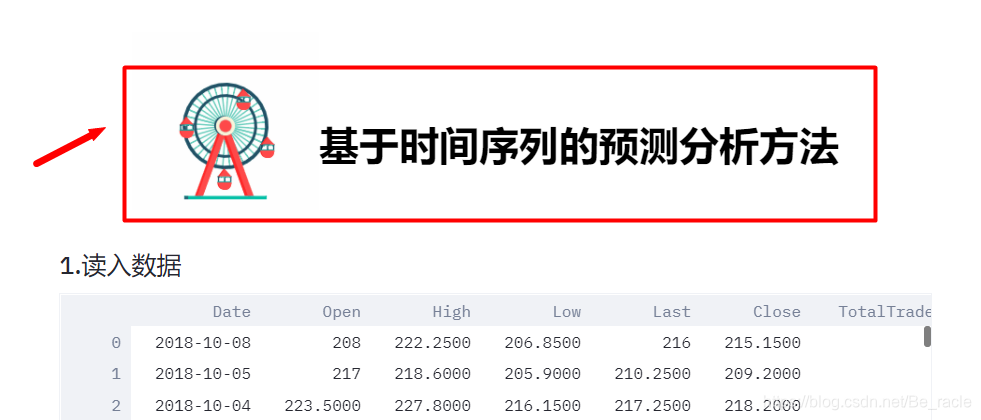
3.1 读入数据
这里的数据我用的是固定的 股价数据 ,当然在streamlit中提供“上传文件”的命令file_uploader,这样我们就可以选择其他的数据源。
    st.subheader('1.读入数据')
    df = pd.read_csv('NSE-TATAGLOBAL11.csv')
    st.dataframe(df)
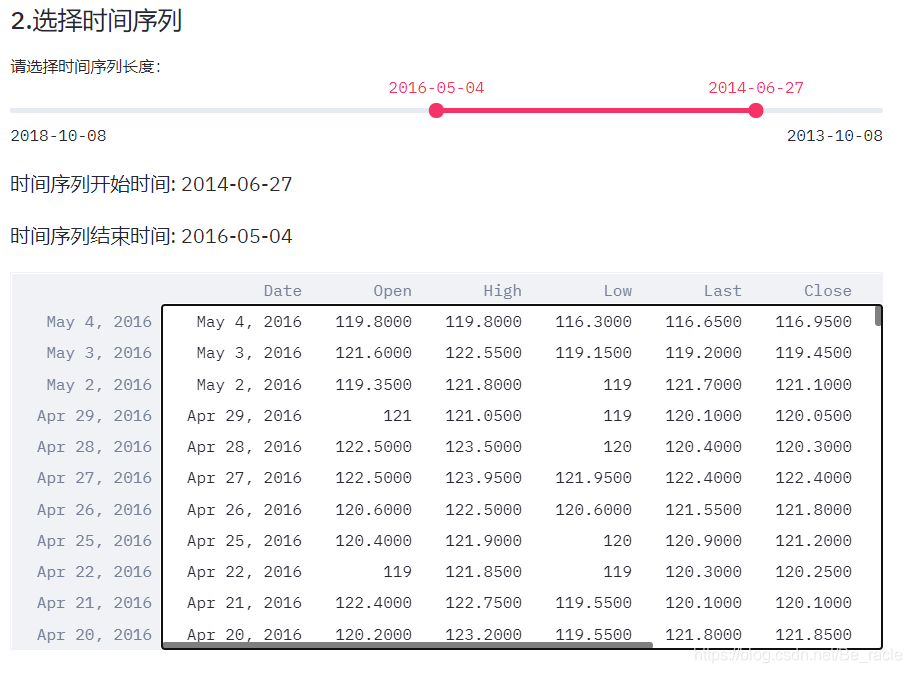
3.2 选择时间序列
通过st.select_slider选择时间序列长度。需要注意的是,我们必须保证滑动条上的每一个数据点都能在源数据集中找到,不然可能会出现错误。
    st.subheader('2.选择时间序列')
    options = np.array(df['Date']).tolist()

    (start_time, end_time) = st.select_slider("请选择时间序列长度:",
         options = options,
         value= ('2016-05-04','2014-06-27',),
     )
    st.write("时间序列开始时间:",end_time)
    st.write("时间序列结束时间:",start_time)

    #setting index as date
    df['Date'] = pd.to_datetime(df.Date, format = '%Y-%m-%d')
    df.index = df['Date']

    df = df[start_time:end_time]
    st.dataframe(df)
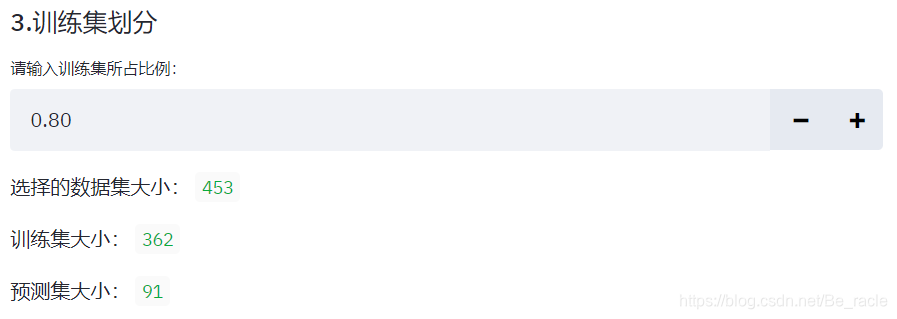
3.3 划分训练集
训练集默认大小是选择的数据集的80%,可选区间是50%~90%,间隔10%。
    st.subheader('3.训练集划分')
    number = st.number_input("请输入训练集所占比例:",min_value=0.5,max_value=0.9,value=0.8,step=0.1)
    split = int(number * len(df))
    st.write("选择的数据集大小:",len(df))
    st.write("训练集大小:",split)
    st.write("预测集大小:",len(df)-split)
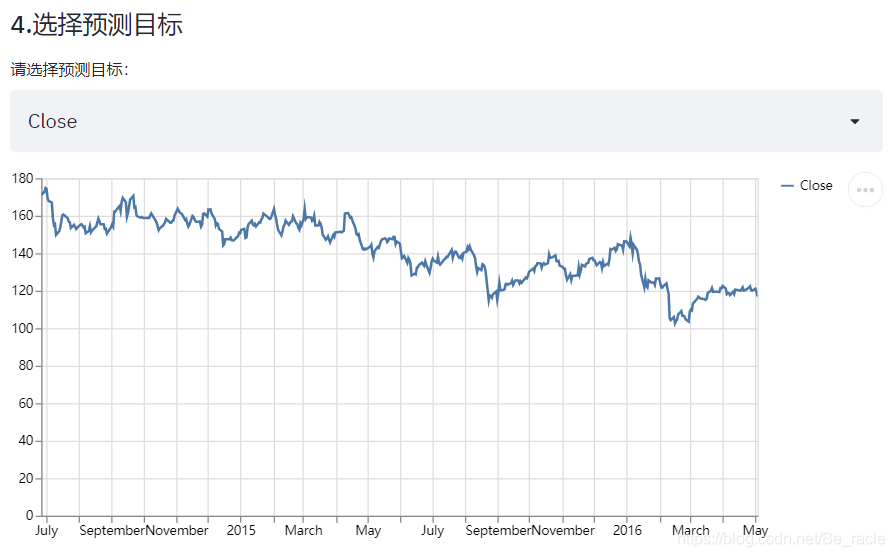
3.4 选择预测目标
通过selectbox选择需要预测的目标列。
    st.subheader('4.选择预测目标')
    type = st.selectbox('请选择预测目标:',('Close','Turnover'))
    st.line_chart(df[type])
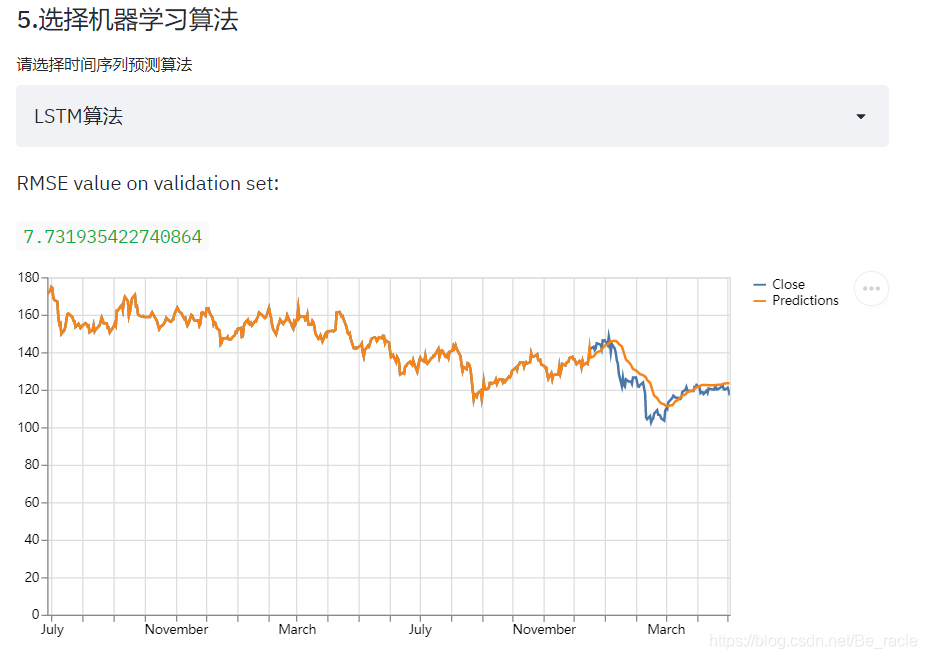
3.5 选择预测算法
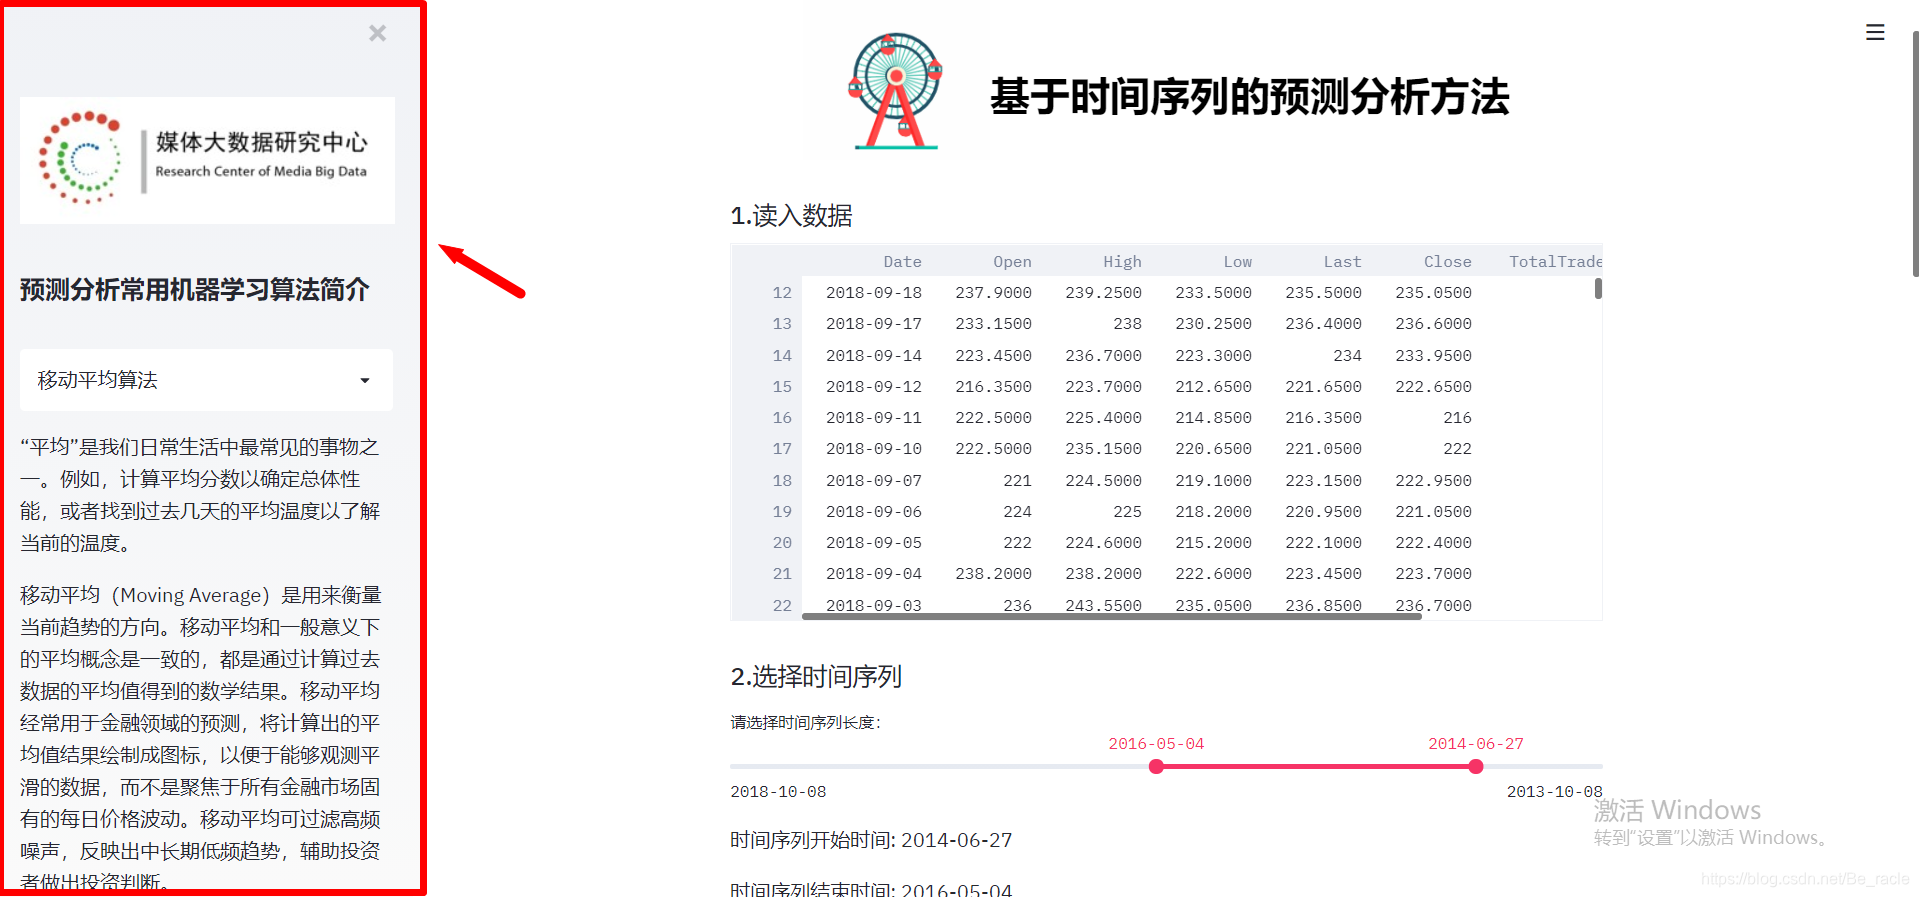
这里一共用到了5种算法,分别是 [ 移动平均
](https://blog.csdn.net/Be_racle/article/details/112600268) 、 [ 线性回归
](https://blog.csdn.net/Be_racle/article/details/112604437) 、 [ 最近邻
](https://blog.csdn.net/Be_racle/article/details/112747349) 、 [ AutoARIMA
](https://blog.csdn.net/Be_racle/article/details/112780195) 和 [ LSTM
](https://blog.csdn.net/Be_racle/article/details/112999853) ,在之前的博客中有详细的介绍。
    st.subheader('5.选择机器学习算法')
    genre = st.selectbox("请选择时间序列预测算法",
         ('移动平均算法', '线性回归算法', '最近邻算法', 'AutoARIMA算法', 'LSTM算法'))
    if genre == '移动平均算法':
        MovingAverage(df, type, split)
    elif genre == '线性回归算法':
         LinearRegression(df, type, split)
    elif genre == '最近邻算法':
         KNearestNeighbours(df, type, split)
    elif genre == 'AutoARIMA算法':
        AutoARIMA(df, type, split)
    elif genre == 'LSTM算法':
        LongShortTM(df, type, split)
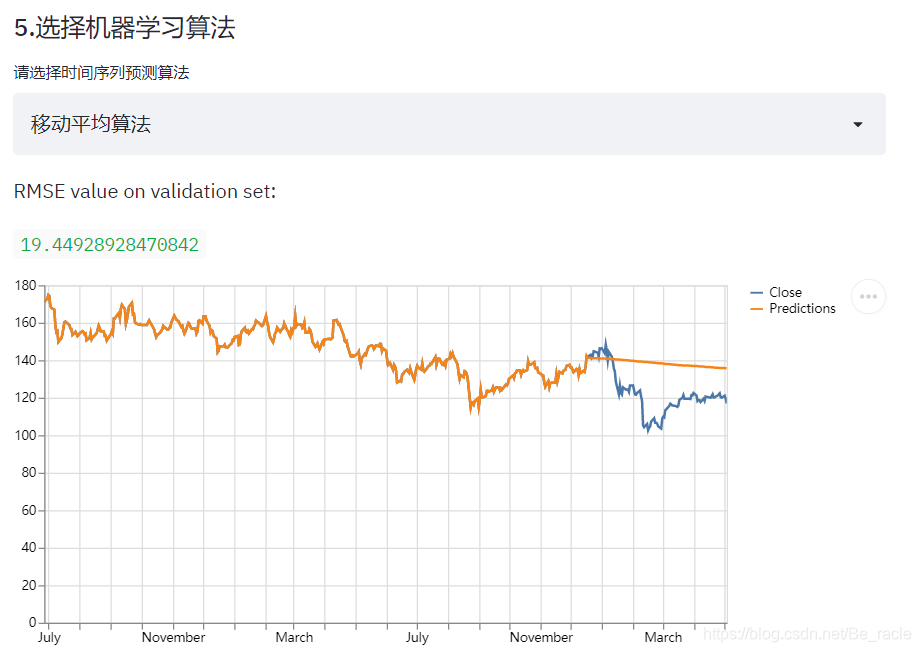
选择不同的算法会有不同的预测效果。正如前面几篇博客总结的那样,LSTM在这个数据集上会有比较好的预测效果。
3.6 其他说明
侧边栏我们可以通过streamlit.sidebar实现
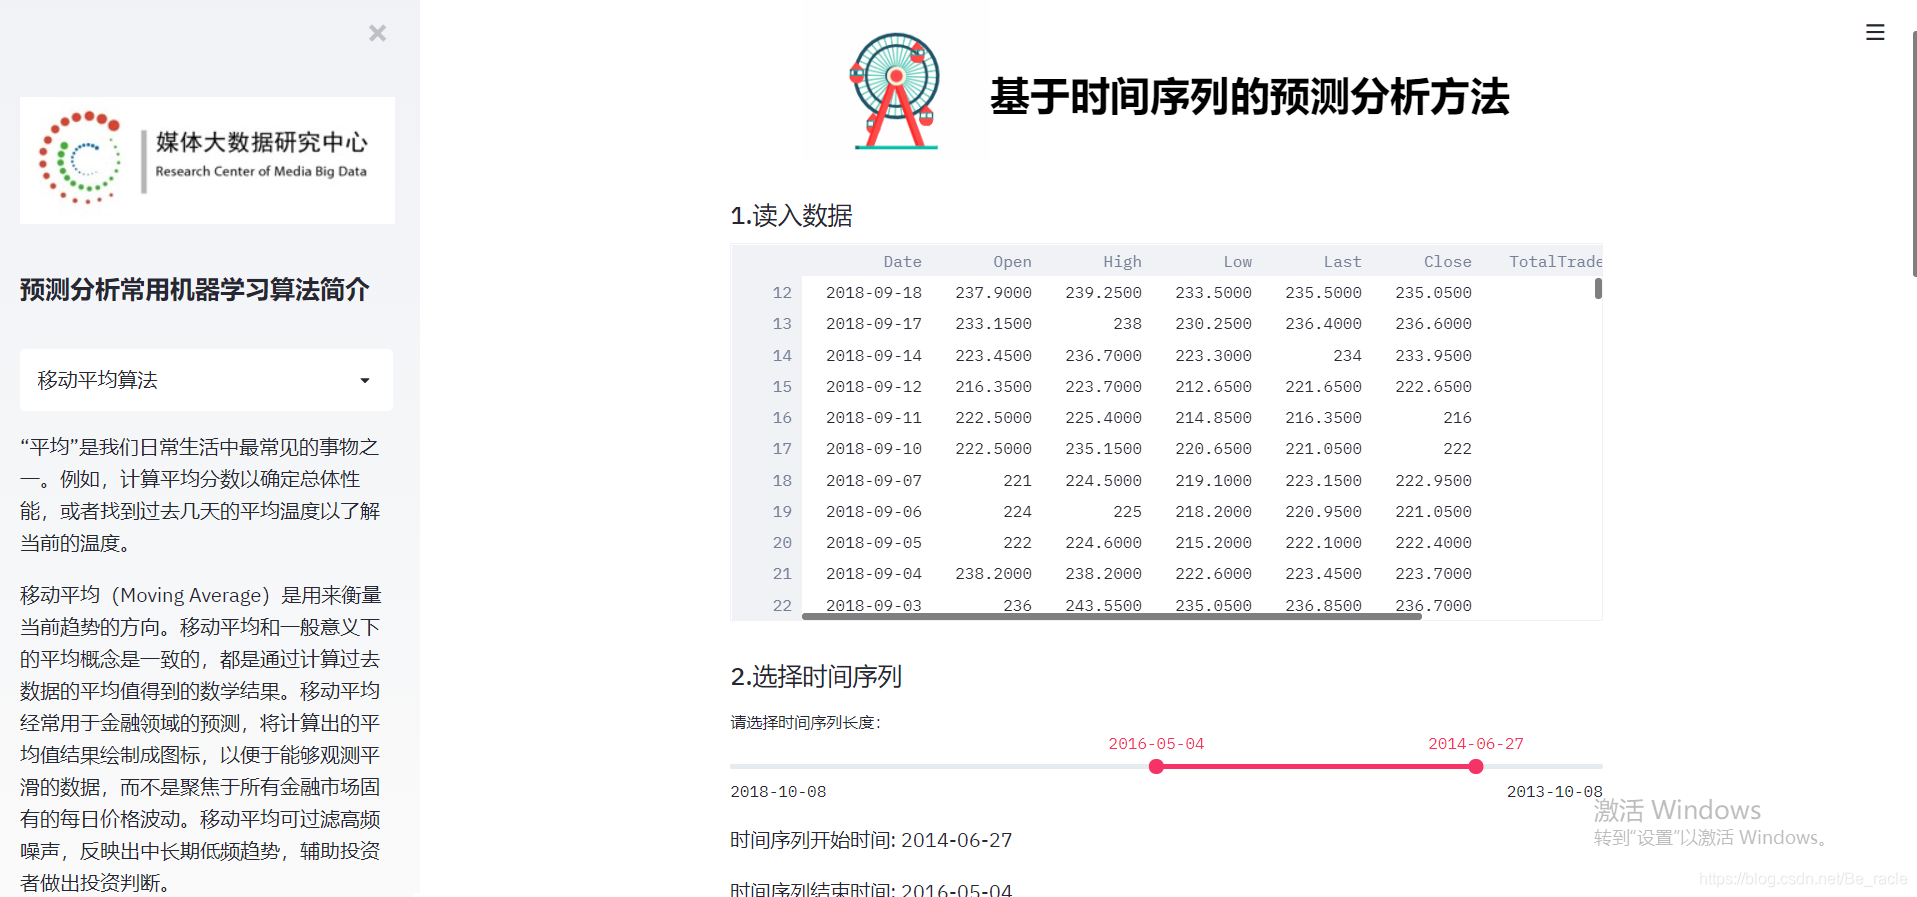
    st.sidebar.image('BigDataCenter.jpg',width=300)
    st.sidebar.header("预测分析常用机器学习算法简介")
    choose = st.sidebar.selectbox("",('移动平均算法','线性回归算法',
                         '最近邻算法','AutoARIMA算法','LSTM算法'))
    if choose == '移动平均算法':
        st.sidebar.write('')
        st.sidebar.image('MVPicture.png',width=300)
        st.sidebar.write()
    elif choose == '线性回归算法':
        st.sidebar.write()
    elif choose == '最近邻算法':
        st.sidebar.write()
    elif choose == 'AutoARIMA算法':
        st.sidebar.write()
    elif choose == 'LSTM算法':
        st.sidebar.write()
但是对于下面这种排版格式,streamlit是没有办法直接做到的,但是我们可以将写好的HTML+CSS文件传到streamlit,其中 [
components.html()
](https://docs.streamlit.io/en/stable/develop_streamlit_components.html)
可以帮助我们做到这一点。
4.源码下载
代码和数据放在了 [ 我的Github ](https://github.com/Beracle/03-Streamlit-Forecast-
WebApp.git) 上,需要的朋友可以自行下载。
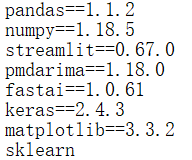
Python:3.8.5
requirements: