2022 NUS summer workshop visual computing phrase2 tutorial3:Digit Recognition notes

1.首先导入sklearn的包,使用fetch_openml导入数据集,代码如下:
fetch_openml函数的各项参数可看:https://scikit-learn.org/stable/modules/generated/sklearn.datasets.fetch_openml.html?highlight=fetch_openml#sklearn.datasets.fetch_openml
from sklearn.datasets import fetch_openml

X,y=fetch_openml('mnist_784',version=1,as_frame=False,return_X_y=True)
Print the dimensions of the variables returned by the function:
print(X.shape)
print(y.shape)
结果为:
(70000, 784)
(70000,)
2.Write a python script to find how many distinct values are present in y?
使用numpy.unique:
import numpy as np
distinct_y = np.unique(y)
print(len(distinct_y))
结果为:
10
3.Select one sample from X for each distinct y value.
使用np.where()方法,代码如下:
distinct_idx=[]

for i in distinct_y:
    distinct_idx.append(np.where(y==i)[0][0])  #先把选取的sample的序号找出来

print(distinct_idx)
结果为:
[1, 3, 5, 7, 2, 0, 13, 15, 17, 4]
4.Resize each sample to represent the 28x28 pixel image.
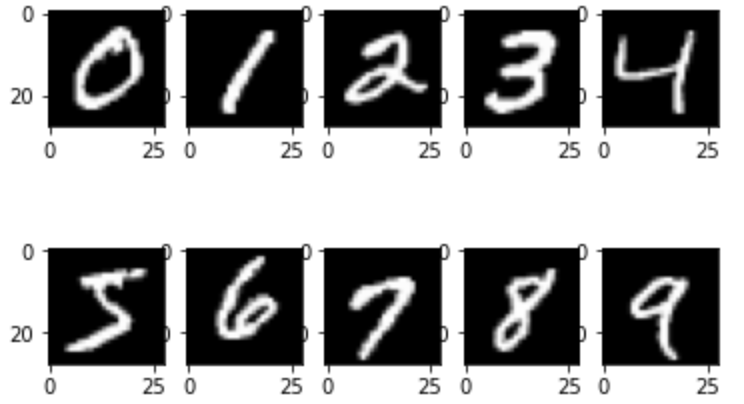
5.Display all the selected images in one diagram using subplots in matplotlib.
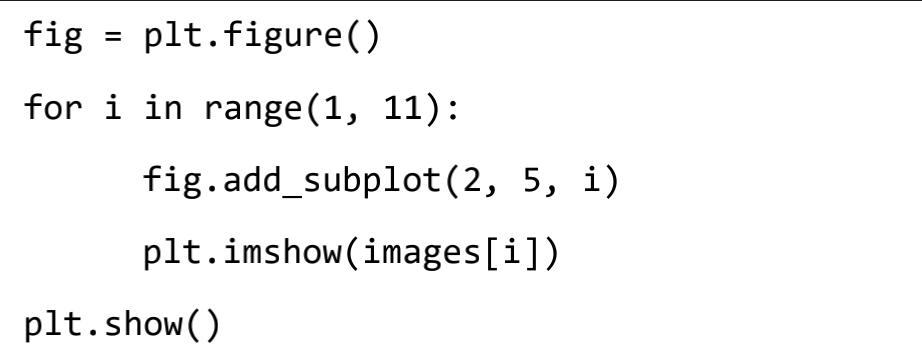
4和5一起做 展示图片需要使用到matplotlib库,代码如下:
import matplotlib.pyplot as plt
fig = plt.figure()

for i,j in enumerate(distinct_idx):
    image=X[j].reshape((28,28))

    fig.add_subplot(2,5,i+1)
    plt.imshow(image,cmap='gray')
plt.show()
结果为:

到这里 Q1就完成了,接下来完成Q2
Q2:Use sklearn to train a digit classifier.
1. Split the X and y into a training set and testing set of 80-20 split.
使用sklearn.model_selection.train_test_split()方法进行分割,代码如下:
from sklearn.model_selection import train_test_split
X_train, X_test, y_train, y_test = train_test_split(X, y, train_size =0.8,test_size=0.2) #由于我们想要训练集和测试集八二分,因此设置train_size=0.8,test_size=0.2
print(X_train.shape,X_test.shape)
结果为:
(56000, 784) (14000, 784) #70000张图片,有56000张作为训练集,14000张作为测试集
2.Train a Support Vector Machin (SVM) for classification of the digits using the training set.
使用到skclearn.svm.SVC(),代码如下:
from sklearn.svm import SVC
clf_svc = SVC() #could change the value of gamma in SVC()
clf_svc.fit(X_train,y_train)
y_pred = clf_svc.predict(X_test)
3.Test the model using the test set.
用模型的准确率(accuracy)来衡量模型的优劣,计算准确度使用到sklearn.metrics.accuracy_score():
from sklearn import metrics
accuracy = metrics.accuracy_score(y_test,y_pred)
print(accuracy)
结果为:
0.9797857142857143 #准确率还不错
4.Experiment with different parameter values for the SVM and see how it performs. Try changing the gamma value to be [0.0001, 0.0005, 0.001, 0.005, 0.01]
gm=[0.0001,0.0005,0.001,0.005,0.01]
accuracy = []
for i in gm:
    clf_svc = SVC(gamma=i)
    clf_svc.fit(X_train,y_train)
    y_pred = clf_svc.predict(X_test)
    accuracy.append(metrics.accuracy_score(y_test,y_pred))
    print(accuracy)
5.Plot the accuracy value with respect to the change in gamma above.


