
.NetCore下使用Prometheus实现系统监控和警报 (五)进阶自定义收集指标 之 Counter
Prometheus下面定了四种类型的收集方式,下面我们主要来来说下Counter的使用
Nuget导入Prometheus.AspNetCore包
下面先来看下我的Prometheus配置,这里我没有分组了

这里我有三个服务,分别是认证服务40000 用户服务 40001 以及体检服务 40002
配置好了重新用配置启动,已启动kill掉在启动
这里我们访问 http://192.168.0.212:9090/targets,可以看到配置的服务状态都是Up,其实Prometheus中自带了服务发现

Prometheus中默认了很多的信息收集指标,这里我们首先来看我们客户端中都有什么,这个也是说明文档,包括了 说明 Help 类型:Type 以及具体的指标,接下来我以 dotnet_collection_errors_total 来作为例子说明,这里dotnet开始的是这个中间件默认收集的以及window进程、线程相关收集信息
# HELP dotnet_collection_errors_total Total number of errors that occured during collections
# TYPE dotnet_collection_errors_total counter
dotnet_collection_errors_total 0
# HELP dotnet_collection_count_total GC collection count
# TYPE dotnet_collection_count_total counter
dotnet_collection_count_total{generation="2"} 2
dotnet_collection_count_total{generation="0"} 65
dotnet_collection_count_total{generation="1"} 5
# HELP dotnet_totalmemory Total known allocated memory
# TYPE dotnet_totalmemory gauge
dotnet_totalmemory 39616128
# HELP process_windows_working_set Process working set
# TYPE process_windows_working_set gauge
process_windows_working_set 246095872
# HELP process_windows_processid Process ID
# TYPE process_windows_processid gauge
process_windows_processid 1
# HELP process_windows_num_threads Total number of threads
# TYPE process_windows_num_threads gauge
process_windows_num_threads 27
# HELP process_cpu_seconds_total Total user and system CPU time spent in seconds.
# TYPE process_cpu_seconds_total counter
process_cpu_seconds_total 647.22
# HELP process_windows_private_bytes Process private memory size
# TYPE process_windows_private_bytes gauge
process_windows_private_bytes 0
# HELP process_start_time_seconds Start time of the process since unix epoch in seconds.
# TYPE process_start_time_seconds gauge
process_start_time_seconds 1543398602.14
# HELP process_windows_open_handles Number of open handles
# TYPE process_windows_open_handles gauge
process_windows_open_handles 302
# HELP process_windows_virtual_bytes Process virtual memory size
# TYPE process_windows_virtual_bytes gauge
process_windows_virtual_bytes 12190539776
# HELP dotnet_collection_errors_total Total number of errors that occured during collections
# TYPE dotnet_collection_errors_total counter
dotnet_collection_errors_total 0
Help:主要是收集发生错误的数量 说明简介
Type:这里类型就是计数器类型 Counter
指标的名称:dotnet_collection_errors_total 0 这个 0就是计数器 在遇到错误的时候会累加,接下来举一个简单的例子,我们来收集 Get请求的数量 或者 Post请求的数量,这里我们需要在服务中添加一个Counter配置的中间件
具体代码如下: 在Configure中添加
var counter = Metrics.CreateCounter("liyouming_custom_method_count", "collect request method counter", new CounterConfiguration
            {
                LabelNames = new[] { "method" }
            });
app.Use((context, next) =>
            {
                counter.WithLabels(context.Request.Method).Inc();
                   return next();
            });
app.UseMetricServer();
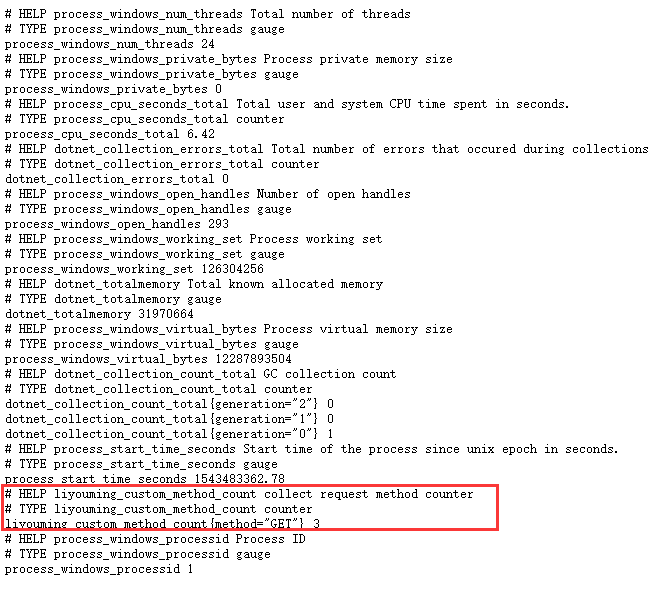
这里我定义了一个Counter的收集器,收集请求信息计数,筛选是method类型, liyouming_custom_method_count 就是制定指标名称,第二个参数是说明,LabelNames是收集信息标签名称,这里需要注意的是 LableNames中的标签名称个数与收集的信息个数需要对应
先来运行项目并访问metrics 可以看到下面的信息,可以看到图中红色部分,我们自定义的信息就添加好了
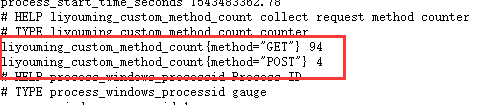
接下来我们多刷新N次这个页面,我们来看下计数

下面我们在来一次post请求一个接口,可以看到Lable分析指标的类型分类计数,说道这里应该明白label是用来干什么的了吧,其实就是分析指标(就是统计分析中统计类型)
下一篇中会结合Grafana的具体使用来使用Prometheus
如果您觉得阅读本文对您有帮助,请点一下“推荐”按钮,您的“推荐”将是我最大的写作动力!
本文版权归作者和博客园共有,来源网址:http://www.cnblogs.com/liyouming欢迎各位转载,但是未经作者本人同意,转载文章之后必须在文章页面明显位置给出作者和原文连接。

 浙公网安备 33010602011771号