gperftools之cpu-profiler使用小结
0.背景
gperftools是google开发的一款非常实用的工具集,主要包括:性能优异的malloc free内存分配器tcmalloc;基于tcmalloc的堆内存检测和内存泄漏分析工具heap-profiler,heap-checker;基于tcmalloc实现的程序CPU性能监测工具cpu-profiler.
github地址
上述所说的三种工具在我们服务器进程的性能分析监控,定位内存泄漏,寻找性能热点,提高malloc free内存分配性能的各个方面上都有非常成功的使用经验.
1. 编译安装
wget https://github.com/gperftools/gperftools/releases/download/gperftools-2.9.1/gperftools-2.9.1.zip
unzip gperftools-2.9.1.zip
cd gperftools-2.9.1
./configure
make -j8
sudo make install
2. 使用
2.1 编译
官方文档: Gperftools CPU Profiler
编译时设置编译选项 -lprofiler ,添加链接目录 /usr/local/lib .
cmake 添加如下代码会链接动态库
# gperftools
if(CMAKE_GPERF_TOOLS)
 set(CMAKE_CXX_FLAGS "-lprofiler ${CMAKE_CXX_FLAGS}")
 link_directories("/usr/local/lib")
 message("-lprofiler")
endif()
通过如下代码链接静态库
# gperftools
if(CMAKE_GPERF_TOOLS)
 target_link_libraries(test_tools libprofiler.a)
endif()
2.2 运行
头文件: <gperftools/heap-profiler.h>
<google/profiler.h>
程序开始添加代码:ProfilerStart("test_tcp_echo.prof");
程序结束添加代码: ProfilerStop();
运行程序到自然结束或者捕捉信号去调用ProfilerStop();
2.3 查看性能报告 text版本
pprof ./test_tools_forward test_tcp_forward.prof --text
结果:
[liyakai@VM-0-2-centos bin]$ pprof ./test_tools_forward test_tcp_forward.prof --text
Using local file ./test_tools_forward.
Using local file test_tcp_forward.prof.
Total: 2847 samples
    1221  42.9%  42.9%     1227  43.1% __libc_send
     451  15.8%  58.7%      457  16.1% __libc_recv
     179   6.3%  65.0%      183   6.4% __GI_epoll_wait
     111   3.9%  68.9%      111   3.9% __memmove_ssse3_back
      35   1.2%  70.1%       35   1.2% __nanosleep_nocancel
      35   1.2%  71.4%       35   1.2% std::__detail::_Mod_range_hashing::operator
      25   0.9%  72.3%      688  24.2% EpollSocket::UpdateEpollEvent
      25   0.9%  73.1%       31   1.1% __GI___pthread_mutex_unlock
      21   0.7%  73.9%       54   1.9% std::basic_string::basic_string
      20   0.7%  74.6%       29   1.0% __GI___pthread_mutex_lock
      19   0.7%  75.2%       45   1.6% Singleton::Instance
      17   0.6%  75.8%       17   0.6% std::__atomic_base::fetch_add
      16   0.6%  76.4%       16   0.6% RingBuffer::WriteableSize
      16   0.6%  77.0%       16   0.6% std::__once_callable
      15   0.5%  77.5%       15   0.5% RingBuffer::ReadableSize
      14   0.5%  78.0%       79   2.8% std::_Hashtable::_M_find_node
      13   0.5%  78.4%       65   2.3% std::_Hashtable::_M_find_before_node
      13   0.5%  78.9%       13   0.5% std::forward
      13   0.5%  79.3%       13   0.5% std::operator&
      12   0.4%  79.8%       12   0.4% EpollSocket::GetConnID
      12   0.4%  80.2%       80   2.8% std::_Hashtable::find
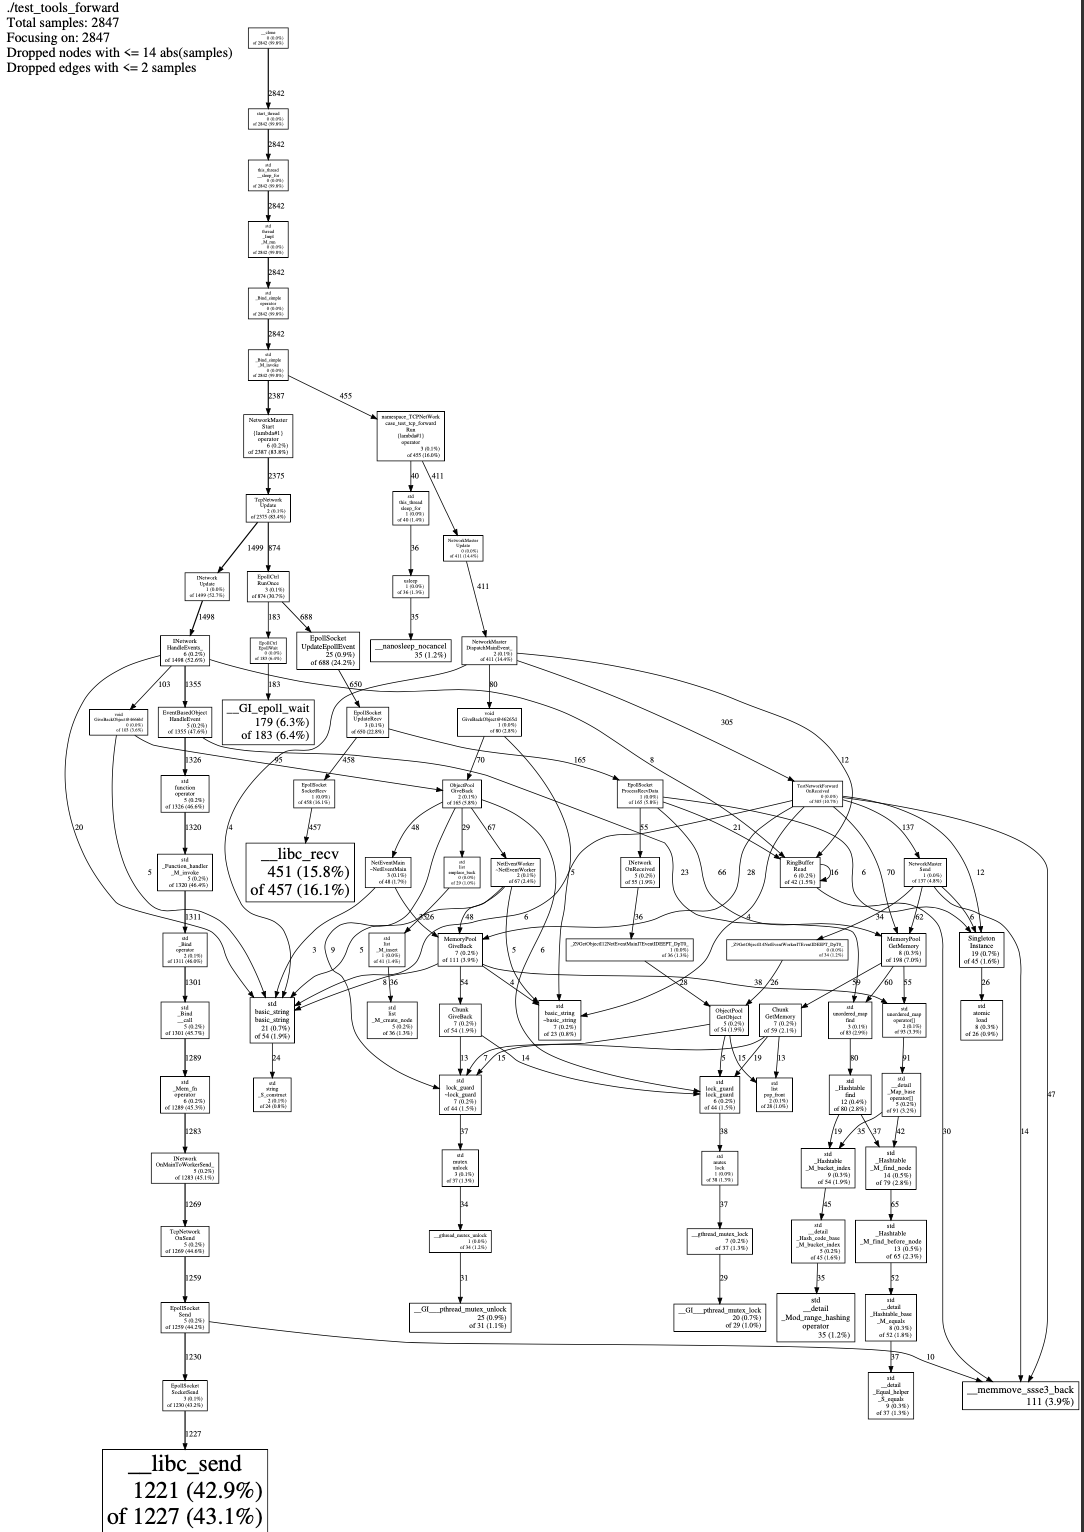
2.4 生成性能报告 pdf版本
执行如下命令 生成pdf版本的报告
pprof ./test_tools_forward test_tcp_forward.prof --pdf > test_tcp_forward.pdf
如果提示 ps2pdf 无效,则需要先安装 ghostscript:
yum install ghostscript
如果提示 sh: dot: not found, 则需要先安装 graphviz:
yum install graphviz
生成结果:

 浙公网安备 33010602011771号