

Redis初级之慢查询日志
慢查询分析
如图所示,为一条客户端命令的生命周期(总共分为四步)
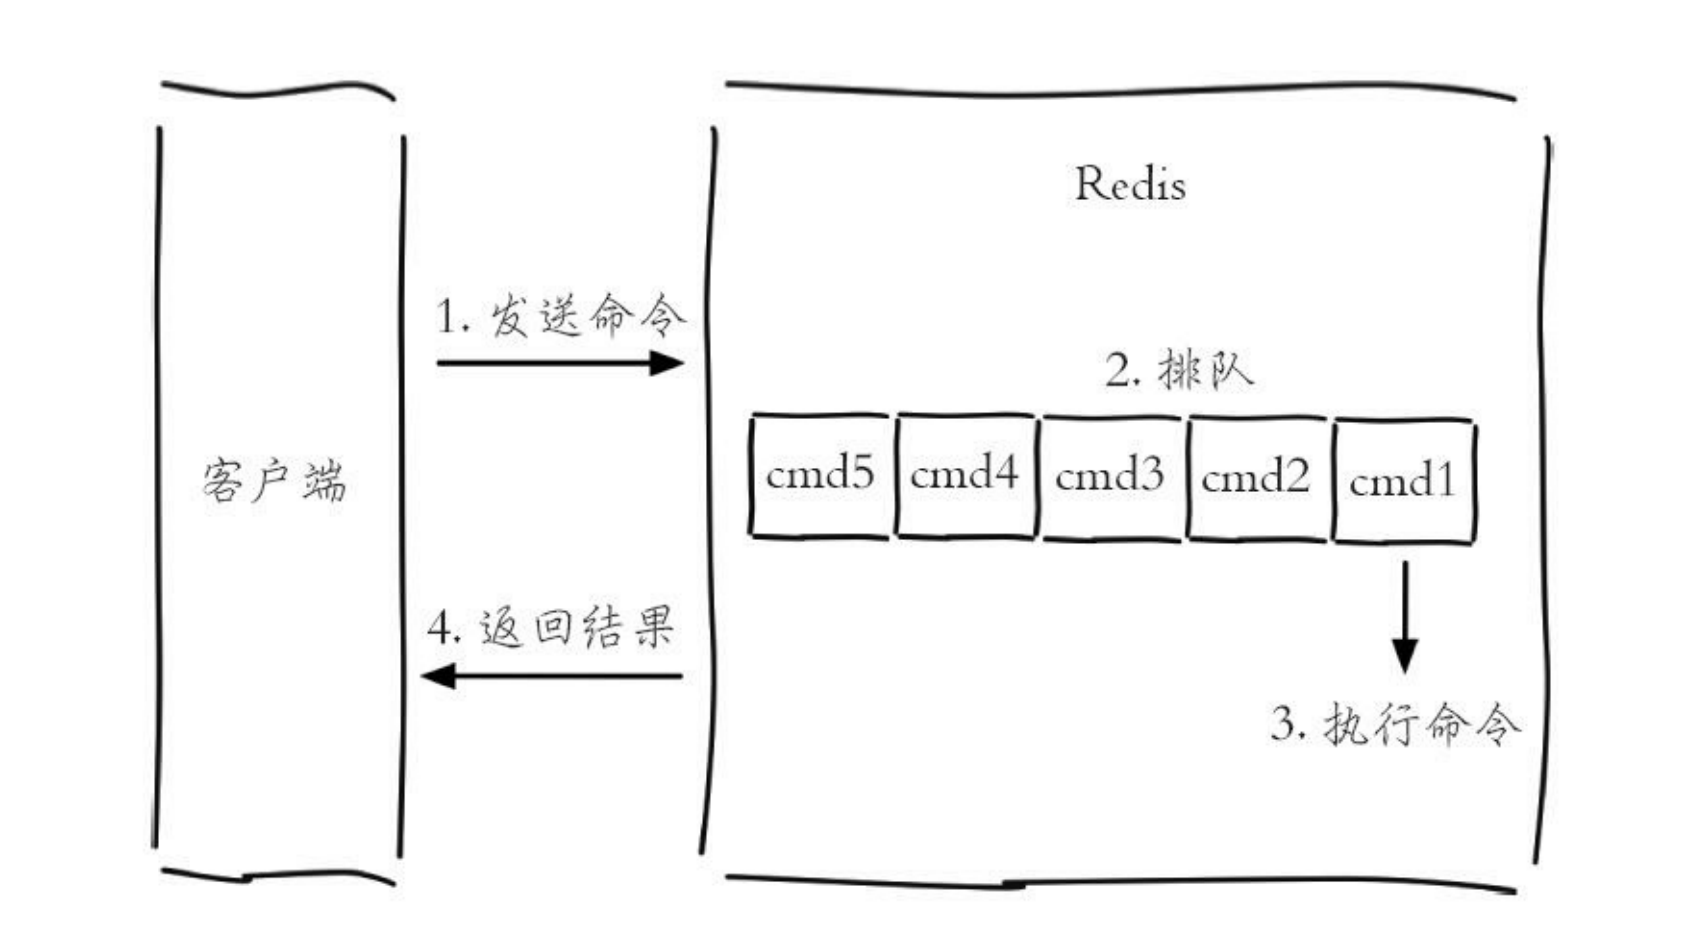
1.发送命令
2.排队等待执行
3.执行命令
4.返回结果
需要注意的是 redis中的慢查询只统计步骤3(执行命令)的时间,所以有时候没有慢查询日志并不代表客户端就没有超时问题。
慢查询的两个配置参数
Redis提供了两个参数来配置慢查询
以下是默认配置文件中对于慢日志查询的描述与配置
################################## SLOW LOG ###################################

# The Redis Slow Log is a system to log queries that exceeded a specified
# execution time. The execution time does not include the I/O operations
# like talking with the client, sending the reply and so forth,
# but just the time needed to actually execute the command (this is the only
# stage of command execution where the thread is blocked and can not serve
# other requests in the meantime).
#
# You can configure the slow log with two parameters: one tells Redis
# what is the execution time, in microseconds, to exceed in order for the
# command to get logged, and the other parameter is the length of the
# slow log. When a new command is logged the oldest one is removed from the
# queue of logged commands.

# The following time is expressed in microseconds, so 1000000 is equivalent
# to one second. Note that a negative number disables the slow log, while
# a value of zero forces the logging of every command.
slowlog-log-slower-than 10000

# There is no limit to this length. Just be aware that it will consume memory.
# You can reclaim memory used by the slow log with SLOWLOG RESET.
slowlog-max-len 128
1.slowlog-log-slower-than
预设阈值,时间单位为微秒(1秒=1000毫秒=1000000微秒)当一条命令的执行时间超过这个阈值时就会被记录到慢查询日志中。
如果slowlog-log-slower-than = 0 则会记录下所有的命令。
如果slowlog-log-slower-than < 0 则对于任何命令都不会进行记录。
2.slowlog-max-len
从字面上来看这个配置参数用来设置可以存储的慢查询日志的最大条数,并没有说明慢查询日志保存在哪里,实际上Redis使用了一个列表用来保存慢查询日志,这个参数就是用来配置慢查询日志列表的最大长度。当一条新的慢查询日志插入到这个列表中时,如果列表长度已经达到了设置的阈值则会删除最早的一条日志,然后插入最新的一条日志。
修改配置文件
在Redis中有两种修改配置的方式,一种是修改配置文件,一种是使用config set命令动态修改配置参数。
# config set parameter value [parameter valuue ...]
config set slowlog-log-slower-than 1000
config set slowlog-max-len 1000

# 还可以使用config rewrite命令使Redis重新加载配置文件
config rewrite
慢查询日志的查看与详情
Redis虽然将慢查询日志存储在了内存列表中,但是并没有暴露列表的键,而是通过一组命令来实现对慢查询日志的查看与管理。
1.获取慢查询日志
slowlog get [n]
# 执行效果
> slowlog get 1
1) 1) "7"
   2) "1732695588"
   3) "9"
   4) 1) "get"
      2) "msg"
   5) "192.168.1.122:58946"
   6) "redisinsight-cli-acc3f540-03df-4a37-a98f-4b9bf26e0a52--262b42c8-a808-45de-819e-11582600fd95-1-1-"
每个慢查询日志主要由6部分组成
第一部分:慢查询日志的id
第二部分:慢查询日志的时间戳
第三部分:慢查询日志的耗时时间
第四部分:慢查询日志的命令和参数
第五部分:客户端的ip地址与端口
第六部分:客户端的名称
2.获取慢查询日志当前的列表长度
slowlog len
# 执行效果
> slowlog len
(integer) 31
3.慢查询日志重置
slowlog reset
# 执行效果
# 实际上是对慢日志列表进行了清理操作
> slowlog len
(integer) 31

> slowlog reset
"OK"

> slowlog len
(integer) 3
实践建议
slowlog-max-len配置建议:线上环境建议调大慢查询日志列表,实际上并不会占用太多内存,如果日志列表过小,肯呢个会导致部分慢查询日志被剔除的可能。
slowlog-log-slower-than配置建议:根绝业务的并发量进行调整。如果并发量高可以不用设置太低,如果并发量比较高就需要将该阈值设置的比较低,以此来优化流程应对高并发的需求。
慢查询只记录命令执行时间,并不包括命令排队和网络传输时间。因此客户端执行命令的时间会大于命令实际执行时间。因为命令执行排队机制,慢查询会导致其他命令级联阻塞,因此当客户端出现请求超时,需要检查该时间点是否有对应的慢查询,从而分析出是否为慢查询导致的命令级联阻塞。
由于慢查询日志是一个先进先出的队列,也就是说如果慢查询比较多的情况下,可能会丢失部分慢查询命令,为了防止这种情况发生,可以定期执行slow get命令将慢查询日志持久化到其他存储中(例如MySQL),然后可以制作可视化界面进行查询与分析。


【推荐】国内首个AI IDE,深度理解中文开发场景,立即下载体验Trae
【推荐】编程新体验,更懂你的AI,立即体验豆包MarsCode编程助手
【推荐】抖音旗下AI助手豆包,你的智能百科全书,全免费不限次数
【推荐】轻量又高性能的 SSH 工具 IShell:AI 加持,快人一步
· 阿里最新开源QwQ-32B,效果媲美deepseek-r1满血版,部署成本又又又降低了!
· 开源Multi-agent AI智能体框架aevatar.ai,欢迎大家贡献代码
· Manus重磅发布:全球首款通用AI代理技术深度解析与实战指南
· 被坑几百块钱后,我竟然真的恢复了删除的微信聊天记录!
· AI技术革命,工作效率10个最佳AI工具