前言
Kubernetes 支持HPA模块进行容器伸缩,默认支持CPU和内存等指标。原生的HPA基于Heapster,不支持GPU指标的伸缩,但是支持通过CustomMetrics的方式进行HPA指标的扩展。我们可以通过部署一个基于Prometheus Adapter 作为CustomMetricServer,它能将Prometheus指标注册的APIServer接口,提供HPA调用。 通过配置,HPA将CustomMetric作为扩缩容指标, 可以进行GPU指标的弹性伸缩。
阿里云容器Kubernetes监控-GPU监控
# kubectl get node
NAME                    STATUS   ROLES    AGE    VERSION
master-11               Ready    master   466d   v1.18.20
master-12               Ready    master   466d   v1.18.20
master-13               Ready    master   466d   v1.18.20
slave-gpu-103           Ready    <none>   159d   v1.18.20
slave-gpu-105           Ready    <none>   160d   v1.18.20
slave-gpu-109           Ready    <none>   160d   v1.18.20
slave-rtx3080-gpu-111   Ready    <none>   6d3h   v1.18.20
kubectl label node slave-gpu-103 aliyun.accelerator/nvidia_name=yes
kubectl taint node slave-gpu-103 gpu_type=moviebook:NoSchedule
- 部署Prometheus 的GPU 采集器,网络采用hostNetwork
# cat gpu-exporter.yaml
apiVersion: apps/v1
kind: DaemonSet
metadata:
  namespace: monitoring
  name: ack-prometheus-gpu-exporter
spec:
  selector:
    matchLabels:
      k8s-app: ack-prometheus-gpu-exporter
  template:
    metadata:
      labels:
        k8s-app: ack-prometheus-gpu-exporter
    spec:
      affinity:
        nodeAffinity:
          requiredDuringSchedulingIgnoredDuringExecution:
            nodeSelectorTerms:
            - matchExpressions:
              - key: aliyun.accelerator/nvidia_name
                operator: Exists
      hostNetwork: true
      hostPID: true
      containers:
      - name: node-gpu-exporter
        image: registry.cn-hangzhou.aliyuncs.com/acs/gpu-prometheus-exporter:0.1-5cc5f27
        imagePullPolicy: Always
        ports:
        - name: http-metrics
          containerPort: 9445
        env:
          - name: MY_NODE_NAME
            valueFrom:
              fieldRef:
                apiVersion: v1
                fieldPath: spec.nodeName
        resources:
          requests:
            memory: 50Mi
            cpu: 200m
          limits:
            memory: 100Mi
            cpu: 300m
        volumeMounts:
        - mountPath: /var/run/docker.sock
          name: docker-sock
      volumes:
      - hostPath:
          path: /var/run/docker.sock
          type: File
        name: docker-sock
      tolerations:
      - effect: NoSchedule
        key: server_type
        operator: Exists
---
apiVersion: v1
kind: Service
metadata:
  name: node-gpu-exporter
  namespace: monitoring
  labels:
    k8s-app: ack-prometheus-gpu-exporter
spec:
  type: ClusterIP
  ports:
  - name: http-metrics
    port: 9445
    protocol: TCP
  selector:
    k8s-app: ack-prometheus-gpu-exporter

---
apiVersion: monitoring.coreos.com/v1
kind: ServiceMonitor
metadata:
  name: ack-prometheus-gpu-exporter
  labels:
    release: ack-prometheus-operator
    app: ack-prometheus-gpu-exporter
  namespace: monitoring
spec:
  selector:
    matchLabels:
      k8s-app: ack-prometheus-gpu-exporter
  namespaceSelector:
    matchNames:
    - monitoring
  endpoints:
  - port: http-metrics
    interval: 30s

#创建GPU 采集器
kubectl apply  -f  gpu-exporter.yaml

#查看Pod 状态
# kubectl get pod -n monitoring -o wide
NAME                                READY   STATUS    RESTARTS   AGE   IP               NODE                    NOMINATED NODE   READINESS GATES
ack-prometheus-gpu-exporter-c2kdj   1/1     Running   0          21h   10.147.100.111   slave-rtx3080-gpu-111   <none>           <none>
ack-prometheus-gpu-exporter-g98zv   1/1     Running   0          21h   10.147.100.105   slave-gpu-105           <none>           <none>
ack-prometheus-gpu-exporter-jn7rj   1/1     Running   0          21h   10.147.100.103   slave-gpu-103           <none>           <none>
ack-prometheus-gpu-exporter-tt7cg   1/1     Running   0          21h   10.147.100.109   slave-gpu-109           <none>           <none>
- prometheus 增加监控GPU 服务器实例列表
# kubectl edit cm -n prometheus prometheus-conf
- job_name: 'GPU服务监控'
static_configs:
#- targets: ['node-gpu-exporter.monitoring:9445']
- targets:
- 10.147.100.103:9445
- 10.147.100.105:9445
- 10.147.100.111:9445
- 10.147.100.109:9445
#重启prometheus 使配置文件生效
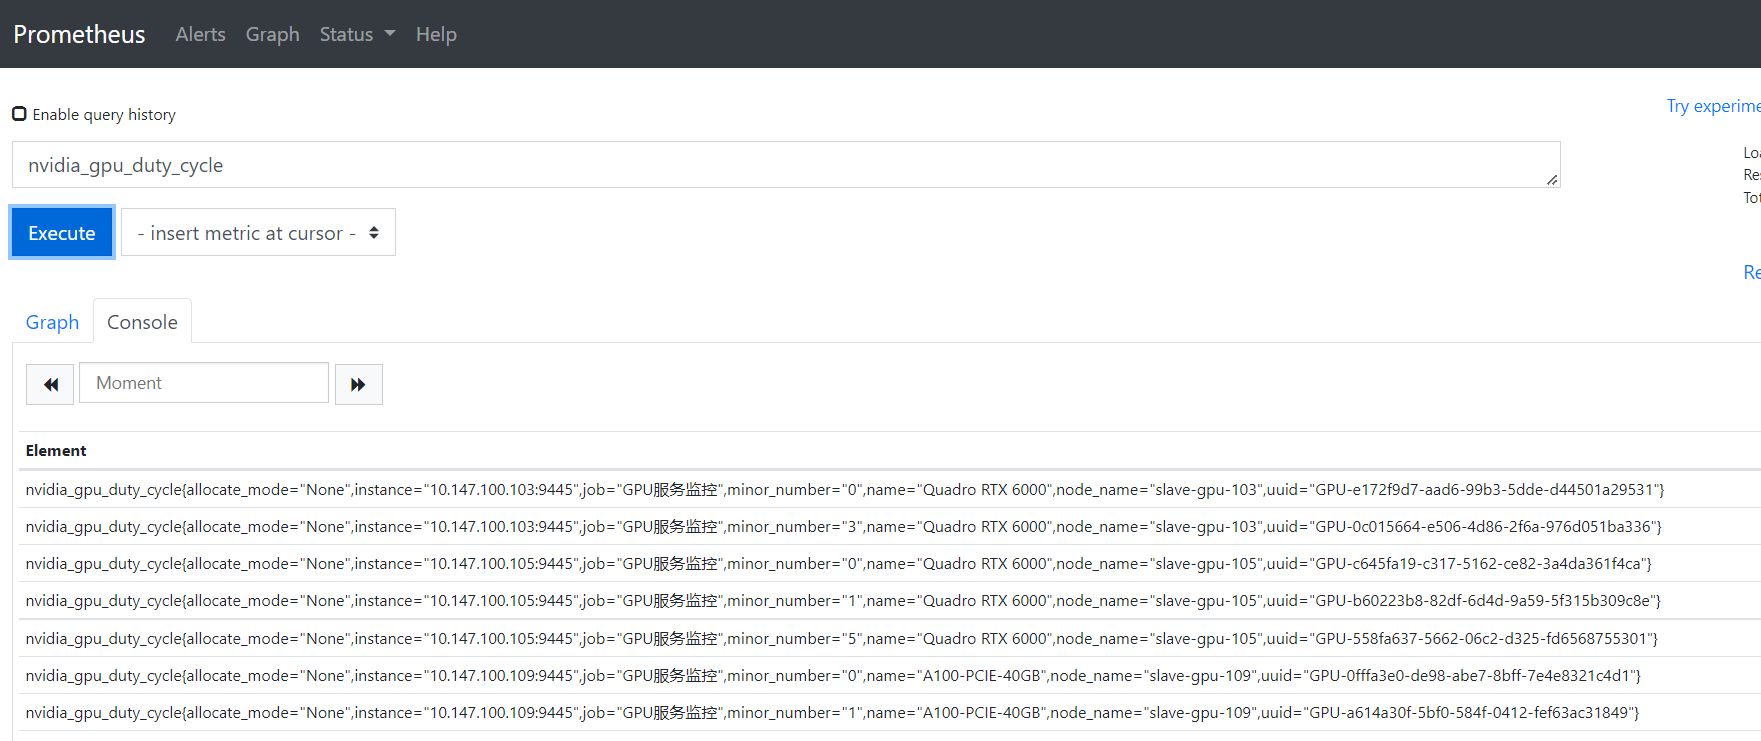
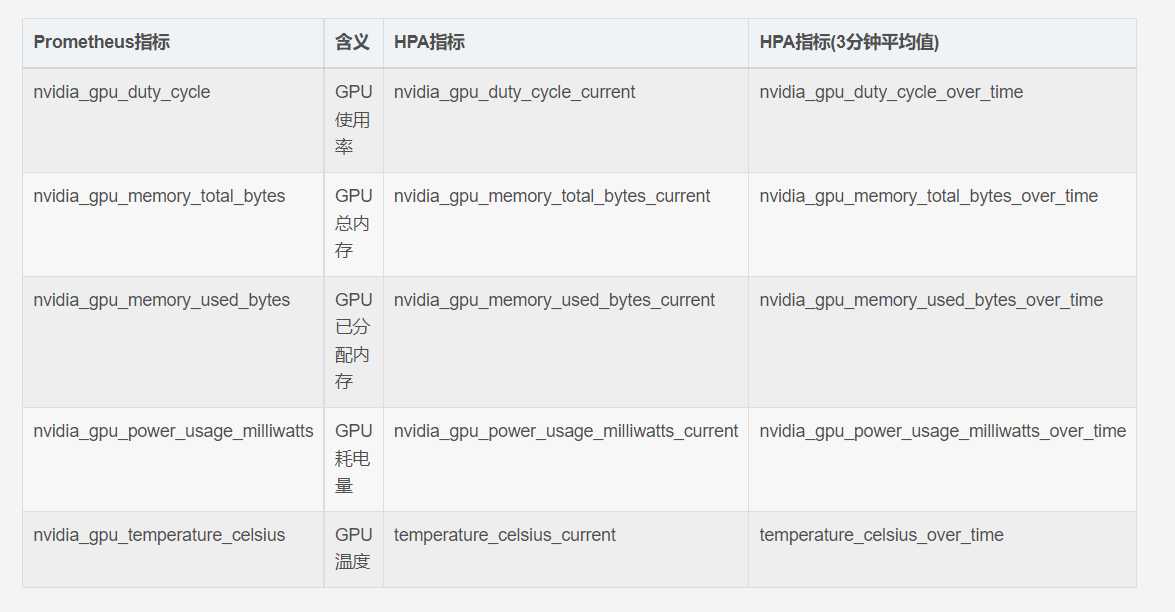
#查看prometheus gpu信息相关指标 nvidia_gpu_duty_cycle
部署CustomMetricServer
#准备证书
mkdir /opt/gpu/
cd /opt/gpu/

set -e
set -o pipefail
set -u
b64_opts='--wrap=0'

export PURPOSE=metrics
openssl req -x509 -sha256 -new -nodes -days 365 -newkey rsa:2048 -keyout ${PURPOSE}-ca.key -out ${PURPOSE}-ca.crt -subj "/CN=ca"
echo '{"signing":{"default":{"expiry":"43800h","usages":["signing","key encipherment","'${PURPOSE}'"]}}}' > "${PURPOSE}-ca-config.json"

export SERVICE_NAME=custom-metrics-apiserver
export ALT_NAMES='"custom-metrics-apiserver.monitoring","custom-metrics-apiserver.monitoring.svc"'
echo "{\"CN\":\"${SERVICE_NAME}\", \"hosts\": [${ALT_NAMES}], \"key\": {\"algo\": \"rsa\",\"size\": 2048}}" | \
           cfssl gencert -ca=metrics-ca.crt -ca-key=metrics-ca.key -config=metrics-ca-config.json - | cfssljson -bare apiserver

cat <<-EOF > cm-adapter-serving-certs.yaml
apiVersion: v1
kind: Secret
metadata:
  name: cm-adapter-serving-certs
data:
  serving.crt: $(base64 ${b64_opts} < apiserver.pem)
  serving.key: $(base64 ${b64_opts} < apiserver-key.pem)
EOF

#创建配置文件
kubectl -n kube-system apply -f cm-adapter-serving-certs.yaml

#查看证书
#kubectl get secrets  -n kube-system  |grep cm-adapter-serving-certs
cm-adapter-serving-certs                         Opaque                                2      49s
- 部署PROMETHEUS CUSTOMMETRIC ADAPTER
# cat  custom-metrics-apiserver.yaml
apiVersion: apps/v1
kind: Deployment
metadata:
  namespace: kube-system
  name: custom-metrics-apiserver
  labels:
    app: custom-metrics-apiserver
spec:
  replicas: 1
  selector:
    matchLabels:
      app: custom-metrics-apiserver
  template:
    metadata:
      labels:
        app: custom-metrics-apiserver
      name: custom-metrics-apiserver
    spec:
      serviceAccountName: custom-metrics-apiserver
      containers:
      - name: custom-metrics-apiserver
        #image: registry.cn-beijing.aliyuncs.com/test-hub/k8s-prometheus-adapter-amd64
        image: quay.io/coreos/k8s-prometheus-adapter-amd64:v0.5.0
        args:
        - --secure-port=6443
        - --tls-cert-file=/var/run/serving-cert/serving.crt
        - --tls-private-key-file=/var/run/serving-cert/serving.key
        - --logtostderr=true
        - --prometheus-url=http://prometheus-service.prometheus.svc.cluster.local:9090/
        - --metrics-relist-interval=1m
        - --v=10
        - --config=/etc/adapter/config.yaml
        ports:
        - containerPort: 6443
        volumeMounts:
        - mountPath: /var/run/serving-cert
          name: volume-serving-cert
          readOnly: true
        - mountPath: /etc/adapter/
          name: config
          readOnly: true
        - mountPath: /tmp
          name: tmp-vol
      volumes:
      - name: volume-serving-cert
        secret:
          secretName: cm-adapter-serving-certs
      - name: config
        configMap:
          name: adapter-config
      - name: tmp-vol
        emptyDir: {}
---
kind: ServiceAccount
apiVersion: v1
metadata:
  name: custom-metrics-apiserver
  namespace: kube-system
---
apiVersion: v1
kind: Service
metadata:
  name: custom-metrics-apiserver
  namespace: kube-system
spec:
  ports:
  - port: 443
    targetPort: 6443
  selector:
    app: custom-metrics-apiserver
---
apiVersion: rbac.authorization.k8s.io/v1
kind: ClusterRole
metadata:
  name: custom-metrics-server-resources
  namespace: kube-system
rules:
- apiGroups:
  - custom.metrics.k8s.io
  resources: ["*"]
  verbs: ["*"]
---
apiVersion: v1
kind: ConfigMap
metadata:
  name: adapter-config
  namespace: kube-system
data:
  config.yaml: |
    rules:
    - seriesQuery: '{uuid!=""}'
      resources:
        overrides:
          node_name: {resource: "node"}
          pod_name: {resource: "pod"}
          namespace_name: {resource: "namespace"}
      name:
        matches: ^nvidia_gpu_(.*)$
        as: "${1}_over_time"
      metricsQuery: ceil(avg_over_time(<<.Series>>{<<.LabelMatchers>>}[3m]))
    - seriesQuery: '{uuid!=""}'
      resources:
        overrides:
          node_name: {resource: "node"}
          pod_name: {resource: "pod"}
          namespace_name: {resource: "namespace"}
      name:
        matches: ^nvidia_gpu_(.*)$
        as: "${1}_current"
      metricsQuery: <<.Series>>{<<.LabelMatchers>>}
---
apiVersion: rbac.authorization.k8s.io/v1
kind: ClusterRole
metadata:
  name: custom-metrics-resource-reader
rules:
- apiGroups:
  - ""
  resources:
  - namespaces
  - pods
  - services
  verbs:
  - get
  - list
---
apiVersion: rbac.authorization.k8s.io/v1
kind: ClusterRoleBinding
metadata:
  name: hpa-controller-custom-metrics
roleRef:
  apiGroup: rbac.authorization.k8s.io
  kind: ClusterRole
  name: custom-metrics-server-resources
subjects:
- kind: ServiceAccount
  name: horizontal-pod-autoscaler
  namespace: kube-system

#创建配置文件
kubectl apply -f custom-metrics-apiserver.yaml

#查看pod 状态
# kubectl get pod -n kube-system  |grep custom-metrics-apiserver
custom-metrics-apiserver-56777c5757-b422b   1/1     Running   0          64s
# cat custom-metrics-apiserver-rbac.yaml
apiVersion: apiregistration.k8s.io/v1beta1
kind: APIService
metadata:
  name: v1beta1.custom.metrics.k8s.io
  namespace: kube-system
spec:
  service:
    name: custom-metrics-apiserver
    namespace: kube-system
  group: custom.metrics.k8s.io
  version: v1beta1
  insecureSkipTLSVerify: true
  groupPriorityMinimum: 100
  versionPriority: 100
---
apiVersion: rbac.authorization.k8s.io/v1
kind: ClusterRoleBinding
metadata:
  name: custom-metrics-resource-reader
roleRef:
  apiGroup: rbac.authorization.k8s.io
  kind: ClusterRole
  name: custom-metrics-resource-reader
subjects:
- kind: ServiceAccount
  name: custom-metrics-apiserver
  namespace: kube-system
---
apiVersion: rbac.authorization.k8s.io/v1
kind: ClusterRoleBinding
metadata:
  name: custom-metrics:system:auth-delegator
roleRef:
  apiGroup: rbac.authorization.k8s.io
  kind: ClusterRole
  name: system:auth-delegator
subjects:
- kind: ServiceAccount
  name: custom-metrics-apiserver
  namespace: kube-system
---
apiVersion: rbac.authorization.k8s.io/v1
kind: RoleBinding
metadata:
  name: custom-metrics-auth-reader
  namespace: kube-system
roleRef:
  apiGroup: rbac.authorization.k8s.io
  kind: Role
  name: extension-apiserver-authentication-reader
subjects:
- kind: ServiceAccount
  name: custom-metrics-apiserver
  namespace: kube-system

#创建rbac
kubectl apply  -f custom-metrics-apiserver-rbac.yaml
#部署完成后,可以通过customMetric的ApiServer调用,验证Prometheus Adapter部署成功
# kubectl get --raw "/apis/custom.metrics.k8s.io/v1beta1/namespaces/default/pods/*/temperature_celsius_current"
{"kind":"MetricValueList","apiVersion":"custom.metrics.k8s.io/v1beta1","metadata":{"selfLink":"/apis/custom.metrics.k8s.io/v1beta1/namespaces/default/pods/%2A/temperature_celsius_current"},"items":[]}
- 查看 kube-controller-manager 服务中是否启用以下参数,未开启需要开启
#参数
--horizontal-pod-autoscaler-use-rest-clients=true

# cat /etc/systemd/system/kube-controller-manager.service |grep horizontal-pod-autoscaler-use-rest-clients
  --horizontal-pod-autoscaler-use-rest-clients=true \
伸缩指标
#伸缩指标信息
测试GPU 服务的弹性扩缩容
| 指标名称 |
说明 |
单位 |
| duty_cycle_current |
GPU利用率 |
百分比 |
| memory_used_bytes_current |
显存使用量 |
字节 |
部署HPA
# cat test-gpu-bert-container-alot.yaml
apiVersion: apps/v1
kind: Deployment
metadata:
  labels:
    name: alot-stream-python
  name: alot-stream-python
  namespace: alot-stream
spec:
  replicas: 1
  selector:
    matchLabels:
      name: alot-stream-python
  strategy:
    rollingUpdate:
      maxSurge: 25%
      maxUnavailable: 25%
    type: RollingUpdate
  template:
    metadata:
      creationTimestamp: null
      labels:
        name: alot-stream-python
    spec:
      containers:
      - image: yz.harborxxx.com/alot/prod/000001-alot-ue4-runtime/python_test:20221114142453
      #- image: registry.cn-hangzhou.aliyuncs.com/ai-samples/bert-intent-detection:1.0.1
        imagePullPolicy: IfNotPresent
        name: alot-stream-python-anmoyi
        resources:
          limits:
            nvidia.com/gpu: "1"
        securityContext:
          runAsGroup: 0
          runAsUser: 0
        terminationMessagePath: /dev/termination-log
        terminationMessagePolicy: File
        volumeMounts:
        - mountPath: /home/wkspace
          name: workdir
        - mountPath: /etc/localtime
          name: hosttime
      dnsPolicy: ClusterFirst
      initContainers:
      - image: yz.harbor.moviebook.com/alot/test/000001-init/node_test:20221114142453
        imagePullPolicy: IfNotPresent
        name: download
        resources: {}
        terminationMessagePath: /dev/termination-log
        terminationMessagePolicy: File
        volumeMounts:
        - mountPath: /home/wkspace
          name: workdir
      restartPolicy: Always
      schedulerName: default-scheduler
      securityContext: {}
      terminationGracePeriodSeconds: 30
      tolerations:
      - effect: NoSchedule
        key: server_type
        operator: Exists
      volumes:
      - emptyDir: {}
        name: workdir
      - hostPath:
          path: /etc/localtime
          type: ""
        name: hosttime

# 创建测试应用
kubectl  apply  -f test-gpu-bert-container-alot.yaml

#查看pod 状态
# kubectl get pod -n alot-stream  |grep -v "prod"
NAME                                                    READY   STATUS    RESTARTS   AGE
alot-stream-python-64ffc68756-fs8lw                     1/1     Running   0          38s
# cat test-hap.yaml
apiVersion: autoscaling/v2beta1
kind: HorizontalPodAutoscaler
metadata:
  name: gpu-hpa-kangpeng
  namespace: alot-stream
spec:
  scaleTargetRef:
    apiVersion: apps/v1
    kind: Deployment
    name: alot-stream-python
  minReplicas: 1
  maxReplicas: 4
  metrics:
  - type: Pods
    pods:
      metricName: duty_cycle_current #Pod的GPU利用率。
      targetAverageValue: 10 #当GPU利用率超过20%,触发扩容。

#创建文件
kubectl apply  -f test-hap.yaml

#查看hpa
# kubectl get hpa -n alot-stream
NAME                            REFERENCE                          TARGETS   MINPODS   MAXPODS   REPLICAS   AGE
gpu-hpa-kangpeng   Deployment/alot-stream-python   0/20      1         4         1          21s

#查看hpa 状态,查看是否有报错信息
# kubectl describe hpa -n alot-stream gpu-hpa-kangpeng
Name:                            gpu-hpa-kangpeng
Namespace:                       alot-stream
Labels:                          <none>
Annotations:                     CreationTimestamp:  Thu, 01 Dec 2022 15:04:25 +0800
Reference:                       Deployment/alot-stream-python
Metrics:                         ( current / target )
  "duty_cycle_current" on pods:  43750m / 10
Min replicas:                    1
Max replicas:                    4
Deployment pods:                 4 current / 4 desired
Conditions:
  Type            Status  Reason               Message
  ----            ------  ------               -------
  AbleToScale     True    ScaleDownStabilized  recent recommendations were higher than current one, applying the highest recent recommendation
  ScalingActive   True    ValidMetricFound     the HPA was able to successfully calculate a replica count from pods metric duty_cycle_current
  ScalingLimited  True    TooManyReplicas      the desired replica count is more than the maximum replica count
Events:
  Type    Reason             Age   From                       Message
  ----    ------             ----  ----                       -------
  Normal  SuccessfulRescale  2m5s  horizontal-pod-autoscaler  New size: 4; reason: pods metric duty_cycle_current above target


#查看pod 副本数,已自动扩展到4副本
# kubectl get pod -n alot-stream   |grep -v "prod"
NAME                                                    READY   STATUS    RESTARTS   AGE
alot-stream-python-64ffc68756-62rsw                     1/1     Running   0          6m3s
alot-stream-python-64ffc68756-9xcgr                     1/1     Running   0          6m3s
alot-stream-python-64ffc68756-drj96                     1/1     Running   0          6m3s
alot-stream-python-64ffc68756-fs8lw                     1/1     Running   0          8m15s
#显存hpa 配置文件
# cat test-hap-kangpeng-memory.yaml
apiVersion: autoscaling/v2beta1
kind: HorizontalPodAutoscaler
metadata:
  name: gpu-hpa-kangpeng-memory
  namespace: alot-stream
spec:
  scaleTargetRef:
    apiVersion: apps/v1
    kind: Deployment
    name: alot-stream-python
  minReplicas: 1
  maxReplicas: 3
  metrics:
  - type: Pods
    pods:
      metricName: memory_used_bytes_current #Pod使用的显存,单位为字节。
      targetAverageValue: 1G #单个Pod显存超过4 GB触发扩容。

#创建配置文件
# kubectl apply  -f  test-hap-kangpeng-memory.yaml

#查看hpa
# kubectl get hpa -n alot-stream
NAME                      REFERENCE                       TARGETS         MINPODS   MAXPODS   REPLICAS   AGE
gpu-hpa-kangpeng-memory   Deployment/alot-stream-python   2562719744/1G   1         3         1          13s

#查看pod扩展状态
# kubectl get pod -n alot-stream  |grep -v "prod"
NAME                                                    READY   STATUS     RESTARTS   AGE
alot-stream-python-64ffc68756-9xcgr                     1/1     Running    0          16m
alot-stream-python-64ffc68756-b8tdh                     0/1     Init:0/1   0          16s
alot-stream-python-64ffc68756-pjr66                     0/1     Init:0/1   0          16s

# kubectl get pod -n alot-stream  |grep -v "prod"
NAME                                                    READY   STATUS    RESTARTS   AGE
alot-stream-python-64ffc68756-9xcgr                     1/1     Running   0          16m
alot-stream-python-64ffc68756-b8tdh                     1/1     Running   0          56s
alot-stream-python-64ffc68756-pjr66                     1/1     Running   0          56s

#待服务处理完请求将自动完成缩容
补充
- 问:如何禁止自动缩容?
答:在创建HPA时,通过配置behavior来禁止自动缩容。
behavior:
  scaleDown:
    policies:
    - type: pods
      value: 0


#完整的HPA配置文件如下
apiVersion: autoscaling/v2beta1
kind: HorizontalPodAutoscaler
metadata:
  name: gpu-hpa
spec:
  scaleTargetRef:
    apiVersion: apps/v1
    kind: Deployment
    name: bert-intent-detection
  minReplicas: 1
  maxReplicas: 10
  metrics:
  - type: Pods
    pods:
      metricName: duty_cycle_current #Pod的GPU利用率。
      targetAverageValue: 20 #GPU利用率超过20%,触发扩容。
  behavior:
  scaleDown:
    policies:
    - type: pods
      value: 0
- 问:如何延迟缩容时间窗口?
答:缩容默认时间窗口(--horizontal-pod-autoscaler-downscale-stabilization-window)是5分钟 ,如果您需要延长时间窗口以避免一些流量毛刺造成的异常,可以指定缩容的时间窗口,behavior 参数配置示例如下:
behavior:
  scaleDown:
    stabilizationWindowSeconds: 600 #等待10分钟后再开始缩容。
    policies:
    - type: pods
      value: 5 #每次只缩容5个Pod。

#上述示例表示当负载下降时,系统会等待600秒(10分钟)后再次进行缩容,每次只缩容5个Pod。
- 问:如果执行kubectl get hpa命令后,发现target一栏为UNKNOWN怎么办?
答:请按照以下步骤进行验证:
a、确认HorizontalPodAutoscaler中指标名字是否正确。
b、执行kubectl get --raw "/apis/custom.metrics.k8s.io/v1beta1"命令,查看返回结果中是否有对应的指标。
c、检查ack-alibaba-cloud-metrics-adapter中配置的Prometheus url是否正确。


