echarts使用记录
init初始化的容器必须有宽度和高度;
容器自动根据调整尺寸可使用 echarts 实例对象的 resize 方法;
<div id="chart" style=" width: 100rem;height: 23rem;" />

this.chart = echarts.init(document.getElementById('chart'))

window.onresize = () => {
    this.chart.resize()
}
饼图的位置不能使用 grid 来控制,要使用 series 里面的 center 属性来控制;
this.chart.setOption({
    ...
    series: [
        {
            name: '费用',
            type: 'pie',
            // 饼图的中心(圆心)坐标
            center:  ['50%', '50%'],
            ...
        }
    ]
})
如果数据标签需要换行可使用 axisLabel 的 formatter 属性,该属性可以是一个函数,我们只需要根据文字的长度每隔指定的字符就添加一个换行符来解决。(注意英文单词需要特殊处理)
this.chart.setOption({
  ...
  xAxis: {
    ...
    // 坐标标签
    axisLabel: {
      formatter: function(val) {
        const strs = val.split('') // 字符串数组
        let str = ''
        for (let i = 0, s; s = strs[i++];) { // 遍历字符串数组
          str += s
          // 每3个字符添加一个 换行符
          if (!(i % 3)) str += '\n'
        }
        return str
      }
    }
  }
})
自定义地图
1.地图的注册和使用
echarts 默认是不包含地图坐标的,我们需要自行下载坐标文件,下载地址:
http://datav.aliyun.com/tools/atlas
根据页面选择自己需要的区域,获取到坐标文件。
例如我想要临沧市的地图,我就得到下面的地址,把json文件下载下来即可。
https://geo.datav.aliyun.com/areas_v2/bound/geojson?code=530900_full
我们只需要把下载的json文件使用echarts的api注册为地图,然后在geo选项中就可以使用这个地图了
const echarts = require('echarts')
// lincang.json 就是下载的geojson
const lincang = require('./lincang.json')
echarts.registerMap('lincang', lincang)

// 配置地图选项:geo的map设置为注册的名称即可
const map = echarts.init(document.getElementById('map'))
const options = {
    geo: {
        map: 'lincang',
    }
}
map.setOption(options)
2.在地图中对特定的区域配置样式
详细查看官方文档 https://echarts.apache.org/zh/option.html#geo.regions
geo.regions中可以添加自定义属性,例如我们现在需要为“临翔区”添加一个属性areaCode,用来保存对应的行政区划,这样就可以携带自定义的属性了。
其他样式可根据官方文档说明进行设置。
{
    // 区划代码
    areaCode: '530902',
    // 区划名称,和地图文件里面的name要一一对应
    name: '临翔区',
    // 设置地图区块的样式
    itemStyle: {
        // 默认状态下
        normal: {
            // 区域颜色
            areaColor: '#1e50e9'
        },
        // 激活状态下的样式
        emphasis: {
            areaColor: '#2453e2'
        }
    }
},
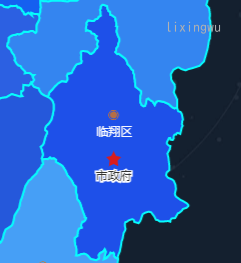
3.市政府所在地的红五星标识

如上图,我们需要在指定位置添加标识,只需要添加一个markPoint即可,根据文档说明
https://echarts.apache.org/zh/option.html#series-scatter.markPoint
我们只需要在series下配置一个markPoint
series: [
    {
        // 设置标记点的类型
        type: 'scatter',
        coordinateSystem: 'geo',
        // 标记点的svg路径
        symbol: 'path://M510.5 104.8c55.1 0 108.5 10.8 158.7 32 48.6 20.5 92.2 50 129.6 87.4 37.5 37.5 66.9 81.1 87.4 129.6 21.3 50.3 32 103.7 32 158.7s-10.8 108.5-32 158.7c-20.5 48.6-50 92.2-87.4 129.6-37.5 37.5-81.1 66.9-129.6 87.4-50.3 21.3-103.7 32-158.7 32-55.1 0-108.5-10.8-158.7-32-48.6-20.5-92.2-50-129.6-87.4-37.5-37.5-66.9-81.1-87.4-129.6-21.3-50.3-32-103.7-32-158.7s10.8-108.5 32-158.7c20.5-48.6 50-92.2 87.4-129.6 37.5-37.5 81.1-66.9 129.6-87.4 50.2-21.2 103.6-32 158.7-32m0-40c-247.3 0-447.8 200.5-447.8 447.8s200.5 447.8 447.8 447.8S958.3 760 958.3 512.6 757.8 64.8 510.5 64.8z M513.2 513.7m-322.8 0a322.8 322.8 0 1 0 645.6 0 322.8 322.8 0 1 0-645.6 0Z',
        // 标记点的大小
        symbolSize: 10,
        symbolKeepAspect: true,
        // 标记点的样式
        itemStyle: {
            color: '#D9751C'
        },
        // 标记点的坐标
        data: [
            { name: '临翔区', value: [100.14, 23.93] },
            { name: '凤庆县', value: [99.87, 24.68] },
            { name: '云县', value: [100.13, 24.41] },
            { name: '永德县', value: [99.47, 24.15] },
            { name: '镇康县', value: [99.02, 24.00] },
            { name: '双江拉祜族佤族布朗族傣族自治县', value: [99.86, 23.48] },
            { name: '耿马傣族佤族自治县', value: [99.35, 23.63] },
            { name: '沧源佤族自治县', value: [99.28, 23.35] }
        ],
        // 添加一个五角星的标识
        markPoint: {
            // 标记点的svg路径
            symbol: 'path://M958.733019 411.348626 659.258367 353.59527 511.998465 85.535095 364.741633 353.59527 65.265958 411.348626 273.72878 634.744555 235.88794 938.463881 511.998465 808.479435 788.091594 938.463881 750.250754 634.744555Z',
            // 标记点的大小
            symbolSize: 15,
            symbolKeepAspect: true,
            // 标记点的样式
            itemStyle: {
                color: '#d91c1c'
            },
            label: {
                show: true,
                position: 'bottom',
                formatter: '{b}'
            },
            // 标记点的坐标
            data: [
                { name: '市政府', coord: [100.14, 23.80] }
            ]
        }
    }
],
4.行政区划和自定义标记点 点击事件
假设我们需要点击对应的行政区域,执行一些操作。
比如:在点击了‘临翔区’时,我们需要根据点击的区块查询对应区域的数据。
这时我们就可以参考文档
https://echarts.apache.org/zh/api.html#echartsInstance.on
// 监听点击事件
map.on('click', (params) => {
    console.log(params)
})
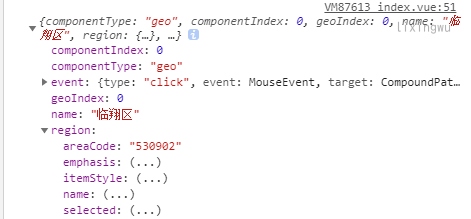
我们根据监听事件回调的参数知道是什么被点击了,例如下面就表示地图区块被点击了,并且我们还能得到之前自定义的数据 areaCode ,我们现在就可在回调函数里根据 areaCode 查询对应的数据了。

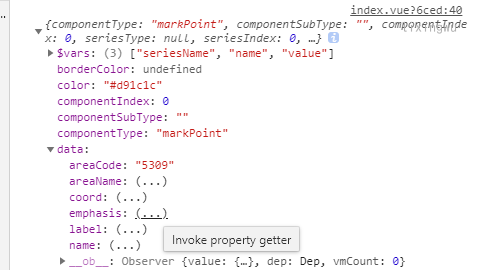
如果点击的是我们定义的五角星标记点(市政府),打印的参数如下:

我们同样可以获取到标记点自定义的属性,我们就能根据点击的类型和数据执行不同的操作。
未完,待续...
原创内容,如果你觉得文章还可以的话,不妨点个赞支持一下!转载请注明出处。


