Python作业7--
函数图形1绘制

import matplotlib.pyplot as plt
import numpy as np

x = np.arange(0, 10, 0.0001)
y1 = x ** 2
y2 = np.cos(x * 2)
y3 = y1 * y2
plt.plot(x, y1,linestyle='-.')
plt.plot(x, y2,linestyle=':')
plt.plot(x, y3,linestyle='--')
plt.savefig("3-1.png")
plt.show()


fig, subs = plt.subplots(2, 2)
subs[0][0].plot(x, y1)
subs[0][1].plot(x, y2)
subs[1][0].plot(x, y3)
plt.savefig("3-2.png")
plt.show()


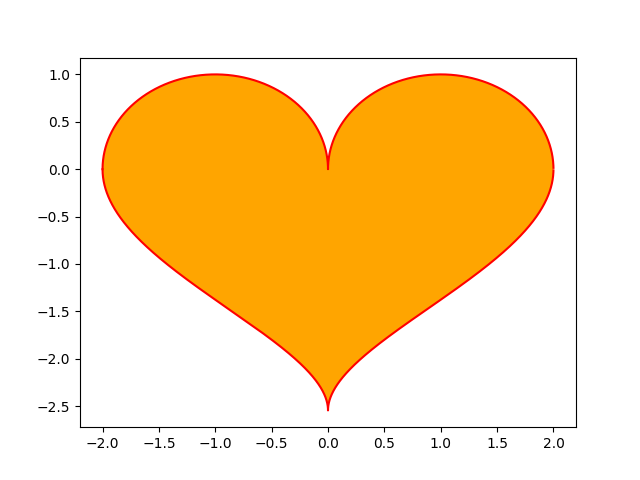
函数图形2绘制

import matplotlib.pyplot as plt
import numpy as np

x = np.arange(-2, 2, 0.0001)
y1 = np.sqrt(2 * np.sqrt(x ** 2) - x ** 2)
y2 = (-2.14) * np.sqrt(np.sqrt(2) - np.sqrt(np.abs(x)))
plt.plot(x, y1, 'r', x, y2, 'r')
plt.fill_between(x, y1, y2, facecolor='orange')
plt.savefig("4-1.png")
plt.show()


【推荐】国内首个AI IDE,深度理解中文开发场景,立即下载体验Trae
【推荐】编程新体验,更懂你的AI,立即体验豆包MarsCode编程助手
【推荐】抖音旗下AI助手豆包,你的智能百科全书,全免费不限次数
【推荐】轻量又高性能的 SSH 工具 IShell:AI 加持,快人一步
· 震惊!C++程序真的从main开始吗?99%的程序员都答错了
· 【硬核科普】Trae如何「偷看」你的代码?零基础破解AI编程运行原理
· 单元测试从入门到精通
· 上周热点回顾(3.3-3.9)
· winform 绘制太阳,地球,月球 运作规律