第十六章 下载数据
1.打印第一列的值并且追到到列表中
filename='D:\\weather.csv'
with open(filename) as f:
    reader=csv.reader(f)
    header_row=next(reader)
    highs=[]
    for row in reader:
      high=int(row[1])
      highs.append(high)
    print(highs)
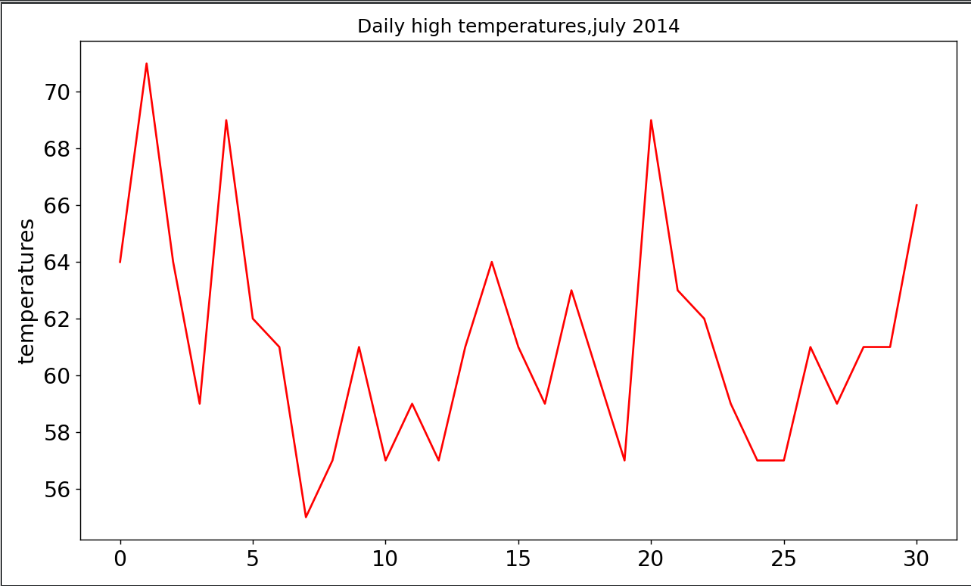
2.绘制高温折线图
import csv
import matplotlib.pyplot as plt
filename='D:\\weather.csv'
with open(filename) as f:
    reader=csv.reader(f)
    header_row=next(reader)
    highs=[]
    for row in reader:
      high=int(row[1])
      highs.append(high)
    print(highs)
#用数据绘制图形
fig=plt.figure(dpi=128,figsize=(10,6))
#设置颜色
plt.plot(highs,c='red')
#设置图形格式
plt.title("Daily high temperatures,july 2014",fontsize=14)
plt.xlabel('',fontsize=16)
plt.ylabel('temperatures',fontsize=16)
plt.tick_params(axis='both',which='major',labelsize=16)
plt.show()
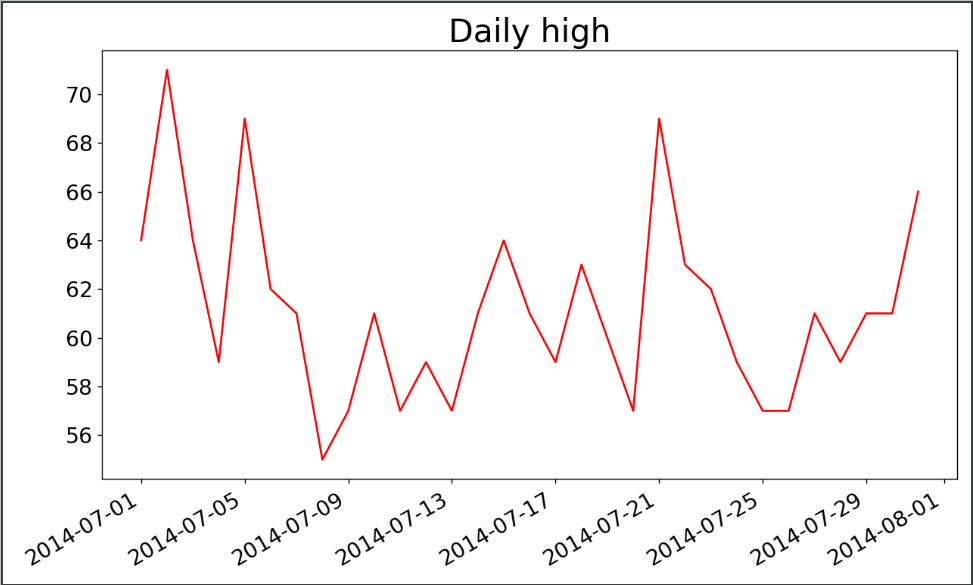
3.加上日期
import csv
from datetime import datetime
import matplotlib.pyplot as plt
filename='D:\\weather.csv'
with open(filename) as f:
    reader=csv.reader(f)
    header_row=next(reader)
    dates,highs=[],[]
    for row in reader:
        current_Date=datetime.strptime(row[0],"%Y/%m/%d")
        dates.append(current_Date)
        high=int(row[1])
        highs.append(high)
#绘制图形
fig=plt.figure(dpi=128,figsize=(10,6))
plt.plot(dates,highs,c='red')
#设置数据绘制图形,设置图形的格式
plt.title("Daily high",fontsize=24)
plt.xlabel('',fontsize=16)
#绘制斜标签
fig.autofmt_xdate()
plt.ylabel('',fontsize=16)
plt.tick_params(axis='both',which='major',labelsize=16)
plt.show()
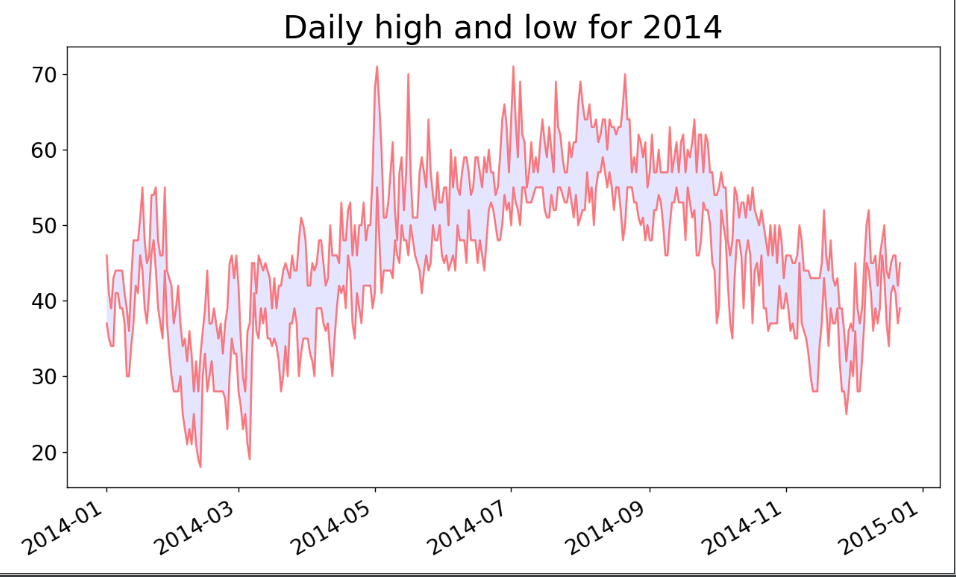
4.添加最低气温
import csv
from datetime import datetime
import matplotlib.pyplot as plt
filename='D:\\weatherTime.csv'
with open(filename) as f:
    reader=csv.reader(f)
    header_row=next(reader)
    dates,highs,lows=[],[],[]
    for row in reader:
        try:
         current_Date=datetime.strptime(row[0],"%Y-%m-%d")
         high=int(row[1])
         low=int(row[3])
        except ValueError:
         print("sorry,data not to get")
        else:
         dates.append(current_Date)
         highs.append(high)
         lows.append(low)
#绘制图形,alpha 是颜色的透明度
fig=plt.figure(dpi=128,figsize=(10,6))
plt.plot(dates,highs,c='red',alpha=0.5)
plt.plot(dates,lows,c='red',alpha=0.5)
plt.fill_between(dates,highs,lows,facecolor='blue',alpha=0.1)
#设置数据绘制图形,设置图形的格式
plt.title("Daily high and low for 2014",fontsize=24)
plt.xlabel('',fontsize=16)
#绘制斜标签
fig.autofmt_xdate()
plt.ylabel('',fontsize=16)
plt.tick_params(axis='both',which='major',labelsize=16)
plt.show()
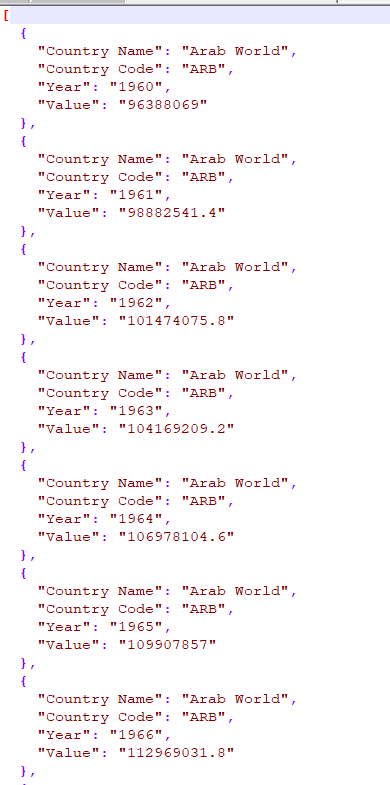
5 获取json 数据
import json
filename='E:\population_data.json'
with open(filename) as f:
    data=json.load(f)
for pop_dict in data:
    if pop_dict['Year'] =='2010':
        coutry_name=pop_dict['Country Name']
        population=int(float(pop_dict['Value']))
        print(coutry_name+": "+str(population))
3.获取国别码
import pygal.maps.world
def getCountryName(coutry_name):
  for code,name in pygal.maps.world.COUNTRIES.items():
      if name == coutry_name:
          return code
  return None

if __name__ == '__main__':
   print(getCountryName("Andorra"))import json
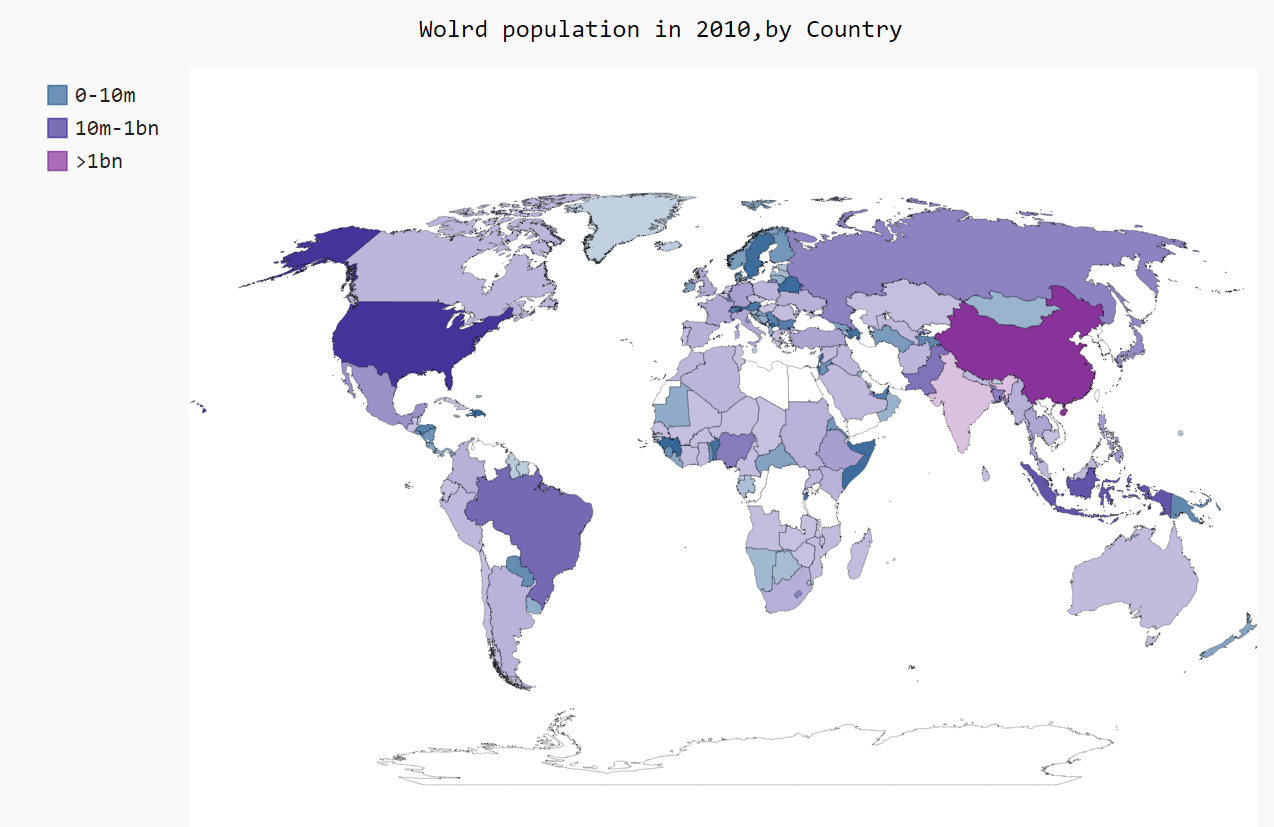
绘制人口地图
import json
import pygal
from pygal.style import RotateStyle
from GetCountryName import getCountryName
filename = 'E:\population_data.json'
with open(filename) as f:
    pop_data = json.load(f)
cc_populations = {}
for pop_dict in pop_data:
    if pop_dict['Year'] == '2010':
        country = pop_dict['Country Name']
        population = int(float(pop_dict['Value']))
        code=getCountryName(country)
        if code:
            cc_populations[code]=population
#将人口数量的所有国家分成3个组
cc1,cc2,cc3={},{},{}
for cc,pop in cc_populations.items():
    if pop<10000000:
        cc1[cc]=pop
    elif pop<1000000000:
        cc2[cc]=pop
    else:
        cc3[cc]=pop
wm_style=RotateStyle('#336699')
wm = pygal.maps.world.World(style=wm_style)
wm.title='Wolrd population in 2010,by Country'
wm.add('0-10m',cc1)
wm.add('10m-1bn',cc2)
wm.add('>1bn',cc3)
wm.render_to_file('world_population.svg')