

图表混搭
折线图与柱状图

        var option = {  //指定图表的配置项和数据
            backgroundColor: 'rgba(128, 128, 128, 0.1)',  //rgba设置透明度0.1
            tooltip: { trigger: 'axis' },
            legend: { data: ['降水量', '蒸发量'], left: 'center', top: 12 },
            xAxis: [
                {
                    type: 'category',
                    data: ['1月', '2月', '3月', '4月', '5月', '6月',
                        '7月', '8月', '9月', '10月', '11月', '12月']
                }
            ],
            yAxis: [
                {   //设置两个Y轴之1:降水量
                    type: 'value', name: '降水量(mL)',
                    min: 0, max: 250,
                    interval: 50,//设置刻度之间的间隔
                    axisLabel: { formatter: '{value}ml ' }
                },
                {   //设置两个Y轴之2:蒸发量
                    type: 'value', name: '蒸发量(mL)', min: 0, max: 200,
                    position: 'right',  //设置y轴安置的位置
                    offset: 0,  //设置向右偏移的距离
                    axisLine: { lineStyle: { color: 'red' } },//设置坐标轴的颜色
                    axisLabel: { formatter: '{value}ml ' }
                }
            ],
            series: [
                {
                    name: '降水量', type: 'bar',
                    itemStyle: {  //设置柱状图颜色
                        normal: {
                            color: function (params) {
                                var colorList = [  //build a color map as your need
                                    '#fe9f4f', '#fead33', '#feca2b', '#fed728', '#c5ee4a',
                                    '#87ee4a', '#46eda9', '#47e4ed', '#4bbbee', '#4f8fa8',
                                    '#4586d8', '#4f68d8', '#F4E001', '#F0805A', '#26C0C0'];
                                return colorList[params.dataIndex]
                            },
                        }
                    },
                    data: [50, 75, 100, 150, 200, 248, 220, 180, 155, 130, 90, 75]
                },
                {
                    name: '蒸发量', type: 'line',
                    yAxisIndex: 1,  //指定使用第2个y轴
                    itemStyle: { normal: { color: 'red' } },  //设置折线颜色
                    data: [58, 65, 90, 120, 130, 180, 150, 130, 125, 110, 150, 145]
                }
            ]
        };
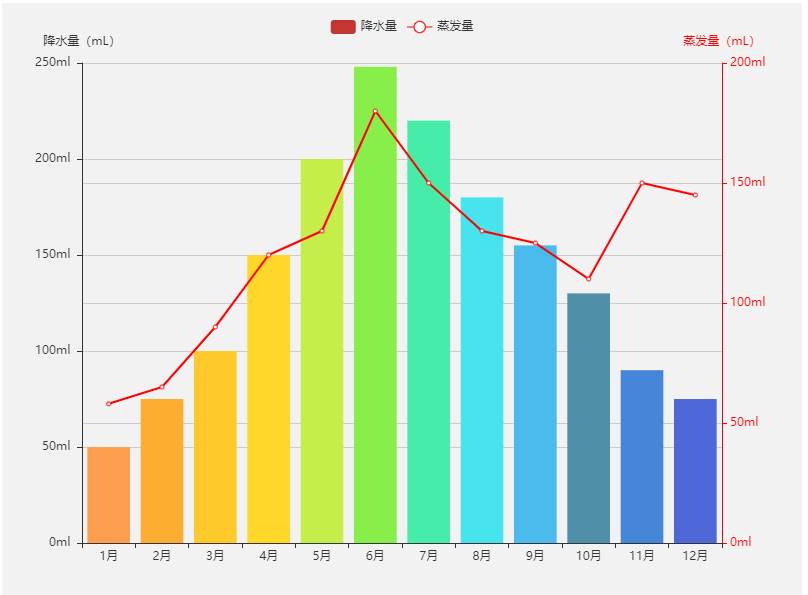
在yAxis数组中通过代码position:'right'指定y轴安置位置(如果没有指定那么默认位置是'left');在series数组中通过代码yAxisIndex:1指定使用第二给y轴(0表示第1个y轴,1表示第2个轴)
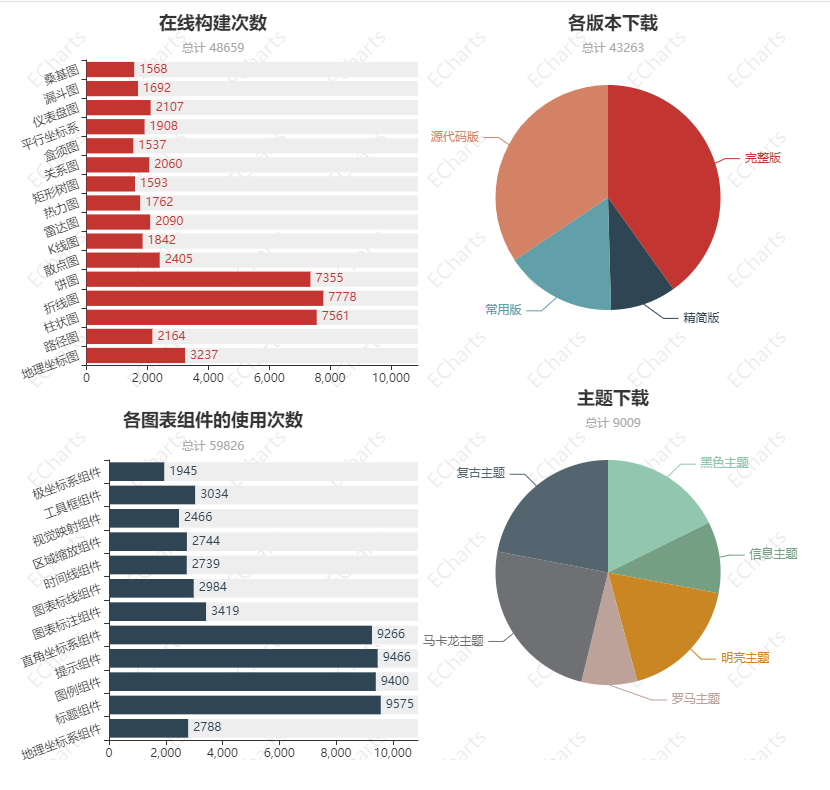
带水印的柱状图与饼图混搭
var builderJson = {
            "all": 10887,
            "charts": {  //各ECharts图表的json数据
                "地理坐标图": 3237, "路径图": 2164, "柱状图": 7561, "折线图": 7778,
                "饼图": 7355, "散点图": 2405, "K线图": 1842, "雷达图": 2090,
                "热力图": 1762, "矩形树图": 1593, "关系图": 2060, "盒须图": 1537,
                "平行坐标系": 1908, "仪表盘图": 2107, "漏斗图": 1692, "桑基图": 1568
            },
            "components": {  //各ECharts组件的json数据
                "地理坐标系组件": 2788, "标题组件": 9575, "图例组件": 9400,
                "提示组件": 9466, "直角坐标系组件": 9266, "图表标注组件": 3419,
                "图表标线组件": 2984, "时间线组件": 2739, "区域缩放组件": 2744,
                "视觉映射组件": 2466, "工具框组件": 3034, "极坐标系组件": 1945
            },
            "ie": 9743
        };
        var downloadJson = {  //各ECharts版本下载的json数据
            "完整版": 17365, "精简版": 4079,
            "常用版": 6929, "源代码版": 14890
        };
        var themeJson = {  //各ECharts下载的主题json数据
            "黑色主题": 1594, "信息主题": 925, "明亮主题": 1608,
            "罗马主题": 721, "马卡龙主题": 2179, "复古主题": 1982
        };
        var waterMarkText = 'ECharts';  //设置水印的字符
        var canvas = document.createElement('canvas');
        var ctx = canvas.getContext('2d');
        canvas.width = canvas.height = 100;
        ctx.textAlign = 'center';
        ctx.textBaseline = 'middle';
        ctx.globalAlpha = 0.08;
        ctx.font = '20px Microsoft Yahei';  //设置水印文字的字体
        ctx.translate(50, 50);  //设置水印文字的偏转值
        ctx.rotate(-Math.PI / 4);  //设置水印旋转的角度
        ctx.fillText(waterMarkText, 0, 0);  //设置填充水印
        var option = {  //指定图表的配置项和数据
            backgroundColor: { type: 'pattern', image: canvas, repeat: 'repeat' },
            tooltip: {},
            title: [{  //配置标题组件
                text: '在线构建次数',
                subtext: '总计 ' + Object.keys(builderJson.charts).reduce(function (all, key) {
                    return all + builderJson.charts[key];
                }, 0),
                x: '25%',
                textAlign: 'center'
            }, {  //配置标题组件
                text: '各图表组件的使用次数',
                subtext: '总计 ' + Object.keys(builderJson.components).reduce(function (all, key) {
                    return all + builderJson.components[key];
                }, 0),
                x: '25%', y: '53%',
                textAlign: 'center'
            }, {
                text: '各版本下载',
                subtext: '总计 ' + Object.keys(downloadJson).reduce(function (all, key) {
                    return all + downloadJson[key];
                }, 0),
                x: '75%', textAlign: 'center'
            }, {
                text: '主题下载',
                subtext: '总计 ' + Object.keys(themeJson).reduce(function (all, key) {
                    return all + themeJson[key];
                }, 0),
                x: '75%', y: '50%',
                textAlign: 'center'
            }],
            grid: [{  //配置网格组件
                top: 50, width: '50%', bottom: '50%',
                left: 10, containLabel: true
            }, {
                top: '55%', width: '50%',
                bottom: 0, top:'60%', left: 10, containLabel: true
            }],
            xAxis: [{  //配置x轴坐标系
                type: 'value',
                max: builderJson.all,
                splitLine: { show: false }
            }, {
                type: 'value',
                max: builderJson.all,
                gridIndex: 1,
                splitLine: { show: false }
            }],
            yAxis: [{  //配置y轴坐标系
                type: 'category',
                data: Object.keys(builderJson.charts),
                axisLabel: { interval: 0, rotate: 20 },
                splitLine: { show: false }
            }, {
                gridIndex: 1,
                type: 'category',
                data: Object.keys(builderJson.components),
                axisLabel: { interval: 0, rotate: 20 },
                splitLine: { show: false }
            }],
            series: [{  //配置数据系列
                type: 'bar', stack: 'chart', z: 3,
                label: { normal: { position: 'right', show: true } },
                data: Object.keys(builderJson.charts).map(function (key) {
                    return builderJson.charts[key];
                })
            }, {
                type: 'bar', stack: 'chart', silent: true,
                itemStyle: { normal: { color: '#eee' } },
                data: Object.keys(builderJson.charts).map(function (key) {
                    return builderJson.all - builderJson.charts[key];
                })
            }, {
                type: 'bar', stack: 'component', xAxisIndex: 1, yAxisIndex: 1, z: 3,
                label: { normal: { position: 'right', show: true } },
                data: Object.keys(builderJson.components).map(function (key) {
                    return builderJson.components[key];
                })
            }, {
                type: 'bar', stack: 'component', silent: true,
                xAxisIndex: 1, yAxisIndex: 1,
                itemStyle: { normal: { color: '#eee' } },
                data: Object.keys(builderJson.components).map(function (key) {
                    return builderJson.all - builderJson.components[key];
                })
            }, {
                type: 'pie', radius: [0, '30%'], center: ['75%', '25%'],
                data: Object.keys(downloadJson).map(function (key) {
                    return {
                        name: key.replace('.js', ''),
                        value: downloadJson[key]
                    }
                })
            }, {
                type: 'pie', radius: [0, '30%'], center: ['75%', '75%'],
                data: Object.keys(themeJson).map(function (key) {
                    return {
                        name: key.replace('.js', ''),
                        value: themeJson[key]
                    }
                })
            }]
        };


【推荐】国内首个AI IDE,深度理解中文开发场景,立即下载体验Trae
【推荐】编程新体验,更懂你的AI,立即体验豆包MarsCode编程助手
【推荐】抖音旗下AI助手豆包,你的智能百科全书,全免费不限次数
【推荐】轻量又高性能的 SSH 工具 IShell:AI 加持,快人一步
· 分享一个免费、快速、无限量使用的满血 DeepSeek R1 模型,支持深度思考和联网搜索!
· 基于 Docker 搭建 FRP 内网穿透开源项目(很简单哒)
· ollama系列01:轻松3步本地部署deepseek,普通电脑可用
· 按钮权限的设计及实现
· 25岁的心里话