柱状图详情配置
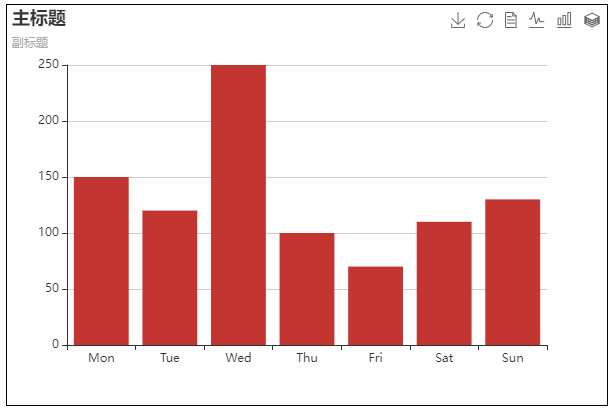
柱状图描述的是分类数据呈现的是每一个分类中有多少,通过柱状图,可以清晰的看出每个分类的排名情况
标准柱状图
var option = {
            title: { //设置标题
                text: '主标题',
                subtext: '副标题',
            },
            legend: {//设置图例
                type:'',//scroll设置为滚动图例,默认为plain
                orient: 'horizontal',//图例对齐方式为水平对齐,垂直对其:'vertical'
                data: []
            },
            tooltip: {//提示框组件
                trigger: 'axis',//设置提示框触发方式。'item',移动到数值上才会触发。'axis',移动到数值附近后自动提示并且有条贯穿数值的竖线
                formatter: "{a}<br/>{b}:{c}"//提示框显示内容
            },
            toolbox: {//工具箱
                feature: {
                    saveAsImage: {},//保存图片
                    restore: {},//配置还原
                    dataView: {},//数据视图
                    magicType: {//数据类型切换
                        type: ['line', 'bar', 'stack']
                    }

                }
            },
            xAxis: {
                type: 'category',
                data: ['Mon', 'Tue', 'Wed', 'Thu', 'Fri', 'Sat', 'Sun']
            },
            yAxis: {
                type: 'value'
            },
            series: [
                {
                    type: 'bar',
                    data: [150, 120, 250, 100, 70, 110, 130],
            barWidthL:'5',//设置柱的宽度
                }
            ]
        };

绘制堆积柱状图
使用stack配置项把数值设置成一样的内容让'谷歌','必应','其他'三个柱状图堆积起来
var option = {
            tooltip:{
                trigger:"axis",
                // axisPointer:{
                //     type:'shadow'
                // },
            },
            legend:{
                data:['直接访问','搜索引擎','百度','谷歌','必应','其他']
            },
            toolbox:{
                show:true,
                orient:'vertical',
                x:'right',
                y:'center',
                feature:{
                    mark:{show:true},
                    dataView:{show:true,readOnly:false},
                    magicType:{
                        show:true,
                        type:["bar","line","stack",'tiled']
                    },
                    restore:{show:true},
                    saveAsImage:{show:true},
                }
            },
            calculable:true,
            xAxis:[
                {
                    type:"category",
                    data:['周一','周二','周三','周四','周五','周六','周日']
                }
            ],
            yAxis:[
                {
                    type:"value"
                }
            ],
            series:[
                {
                    name:'直接访问',
                    type:'bar',
                    data:[320,332,301,334,390,330,320]
                },

                {
                    name:'搜索引擎',
                    type:'bar',
                    data:[862,1018,964,1026,1679,1600,1570],
                    markLine:{  //从最小值到最大值用线连接起来
                        itemStyle:{
                            normal:{
                                lineStyle:{
                                    type:'dashed'
                                }
                            }
                        },
                        data:[
                            [
                                {type:'min'},
                                {type:'max'}
                        ]
                        ]
                    },

                },
                {
                    name:'百度',
                    type:'bar',
                    data:[620,732,701,734,1090,1130,1120]
                },
                {
                    name:'谷歌',
                    type:'bar',
                    stack:'搜索引擎',
                    data:[120,132,101,134,290,230,220]
                },
                {
                    name:'必应',
                    type:'bar',
                    stack:'搜索引擎',
                    data:[60,72,71,74,190,130,110]
                },
                {
                    name:'其他',
                    type:'bar',
                    stack:'搜索引擎',
                    data:[62,82,91,84,109,110,120]
                },
            ]
        }

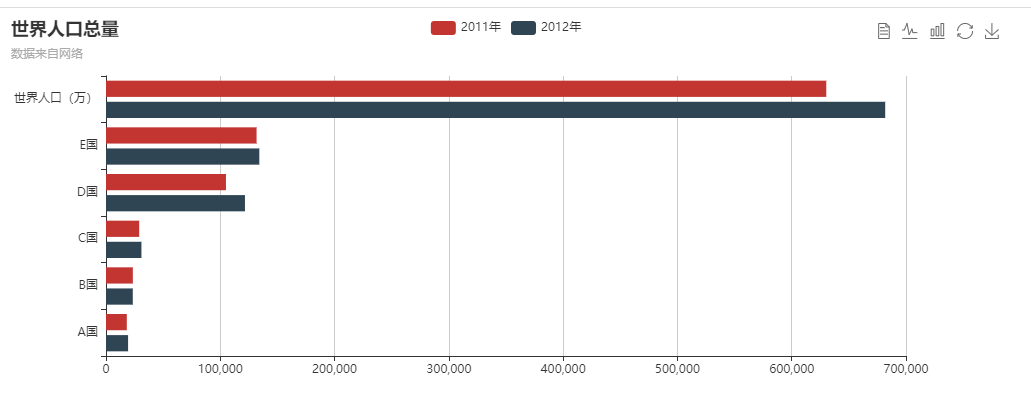
绘制条形图
条形图和柱状图一样的配置只不过xAxis和yAxis里面的内容相互互换了一下
var mychart = echarts.init(document.getElementById("main"))
        var option = {
            title:{
                text:'世界人口总量',
                subtext:'数据来自网络',
            },
            tooltip:{
                trigger:"axis",
            },
            legend:{
                data:['2011年','2012年'],
            },
            toolbox:{
                show:true,
                feature:{
                    mark:{show:true},
                    dataView:{show:true,readOnly:false},
                    magicType:{
                        show:true,
                        type:["line","bar"]
                    },
                    restore:{show:true},
                    saveAsImage:{show:true},
                },
            },
            calculable:true,
            xAxis:[
                {
                    type:"value",
                    boundaryGap:[0,0.01],
                },
            ],
            yAxis:[
                {
                    type:"category",
                    data:['A国','B国','C国','D国','E国','世界人口(万)'],
                },
            ],
            series:[
                {
                    name:'2011年',
                    type:'bar',
                    data:[18203,23489,29034,104970,131744,630230],
                },
                {
                    name:'2012年',
                    type:'bar',
                    data:[19325,23438,31000,121594,134141,681807],
                },
            ]
        };

绘制瀑布图
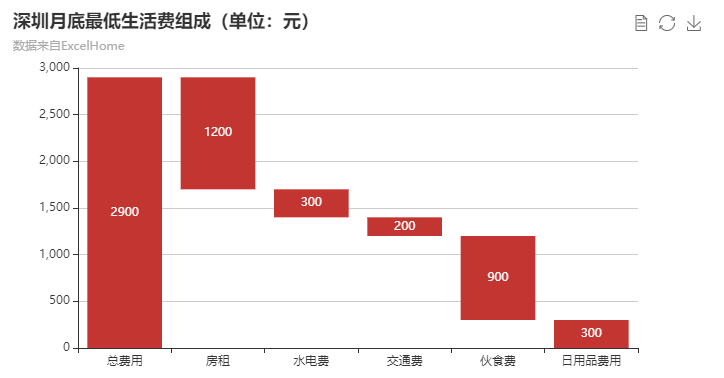
要想形成瀑布效果需要用到stack配置项,通过堆叠数值实现从上往下的瀑布效果,再把设置数值的柱子给透明化这样效果就出来了
      var option = {
            title:{
                text:'深圳月底最低生活费组成(单位:元)',
                subtext:'数据来自ExcelHome  ',
            },
            tooltip:{
                trigger:"axis",
                axisPointer:{
                    typr:'shadow'
                },
                formatter:function(params){
                    var tar = params[0];
                    return tar.name + '<br/>' +tar.seriesName+':'+tar.value;
                }
            },
            toolbox:{
                show:true,
                feature:{
                    mark:{show:true},
                    dataView:{show:true,readOnly:false},
                    restore:{show:true},
                    saveAsImage:{show:true},
                },
            },
            xAxis:[
                {
                    type:'category',
                    splitLine:{show:false},
                    data:['总费用','房租','水电费','交通费','伙食费','日用品费用'],
                },
            ],
            yAxis:[
                {
                    type:"value",
                },
            ],
            series:[
                {
                    name:'辅助',
                    type:'bar',
                    stack:'总量',
                    itemStyle:{
                        normal:{//设置柱子的样式
                            barBorderColor:'rgba(0,0,0,0)',//设置柱子边框颜色
                            //barBorderColor:'rgba(20,20,0,0.5)',
                            barBorederWidth:5,//设置柱子边框宽度
                            color:'rgba(0,0,0,0)',//设置柱子颜色
                            //color:'rgba(0,220,0,0.8)',
                        },
                        emphasis:{//设置鼠标划过时柱子的样式
                            barBorderColor:'rgba(0,0,0,0)',
                            barBorderWidth:25,
                            color:'rgba(0,0,0,0)'
                        }
                    },
                    data:[0,1700,1400,1200,300,0],
                },
                {
                    name:'生活费',
                    type:'bar',
                    stack:'总量',
                    itemStyle:{
                        normal:{
                            label:{
                                show:true,
                                position:'inside'
                            }
                        }
                    },
                    data:[2900,1200,300,200,900,300],
                },
            ]
        };

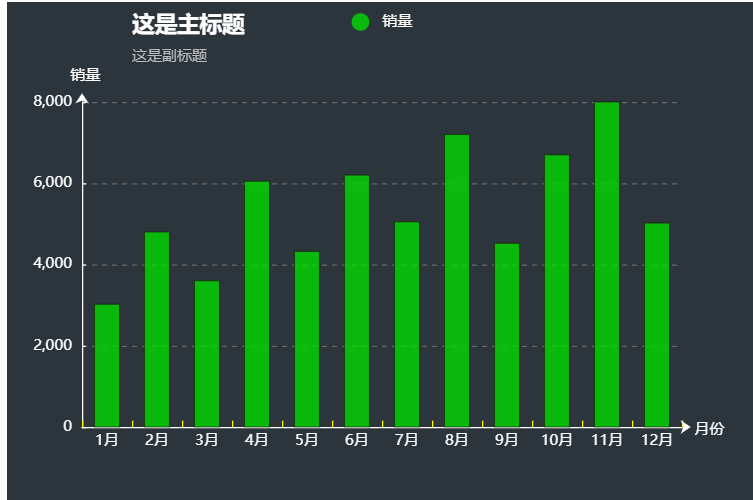
柱状图全部配置项
var option = {
            backgroundColor: '#2c343c',
            title: {  //配置标题组件,包含主标题和副标题
                text: '这是主标题',
                textStyle: {  //设置主标题样式
                    color: '#fff'
                },
                subtext: '这是副标题',  //设置副标题样式
                subtextStyle: {
                    color: '#bbb'
                },
                padding: [10, 0, 100, 100]  //设置标题位置,用padding属性来定位
            },
            legend: {  //配置图例组件
                type: 'plain',  //设置图例类型,默认为'plain',当图例很多时可使用'scroll'
                top: '1%',  //设置图例相对容器位置,top\bottom\left\right
                selected: {
                    '销量': true,  //设置图例是否显示,默认为true
                },
                textStyle: {  //设置图例内容样式
                    color: '#fff',  //设置所有图例的字体颜色
                    //backgroundColor: 'black',  //设置所有图例的字体背景色
                },
                tooltip: {  //设置图例提示框,默认不显示
                    show: true,
                    color: 'red',
                },
                data: [  //设置图例内容
                    {
                        name: '销量',
                        icon: 'circle',  //设置图例的外框样式
                        textStyle: {
                            color: '#fff',  //单独设置某一个图例的颜色
                            //backgroundColor: 'black',  //单独设置某一个图例的字体背景色
                        }
                    }
                ],
            },
            tooltip: {  //配置提示框组件
                show: true,  //设置是否显示提示框,默认为true
                trigger: 'item',  //设置数据项图形触发
                axisPointer: {  //设置指示样式
                    type: 'shadow',
                    axis: 'auto',
                },
                padding: 5,
                textStyle: {  //设置提示框内容样式
                    color: "#fff",
                },
            },
            grid: {  //配置grid区域
                show: false,  //设置是否显示直角坐标系网格
                top: 80,  //设置相对位置,top\bottom\left\right
                containLabel: false,  //设置grid区域是否包含坐标轴的刻度标签
                tooltip: {  //鼠标焦点放在图形上,产生的提示框
                    show: true,
                    trigger: 'item',  //设置触发类型
                    textStyle: {
                        color: '#fff666',  //设置提示框文字的颜色
                    }
                }
            },
            xAxis: {  //配置x轴坐标系
                show: true,  //设置x轴坐标系是否显示
                position: 'bottom',  //设置x轴位置
                offset: 0,  //设置x轴相对于默认位置的偏移
                type: 'category',  //设置轴类型,默认'category'
                name: '月份',  //设置轴名称
                nameLocation: 'end',  //设置轴名称相对位置
                nameTextStyle: {  //设置坐标轴名称样式
                    color: "#fff",
                    padding: [5, 0, 0, -5],
                },  //设置坐标轴名称相对位置
                nameGap: 15,  //设置坐标轴名称与轴线之间的距离
                //nameRotate:270,  //设置坐标轴名字旋转
                axisLine: {  //设置坐标轴轴线
                    show: true,  //设置坐标轴轴线是否显示
                    symbol: ['none', 'arrow'],  //设置是否显示轴线箭头
                    symbolSize: [8, 8],  //设置箭头大小
                    symbolOffset: [0, 7],  //设置箭头位置
                    lineStyle: {  //设置线
                        color: '#fff',  //设置坐标轴轴线的颜色
                        width: 1,  //设置坐标轴轴线的线宽
                        type: 'solid',  //设置坐标轴轴线的线型
                    },
                },
                axisTick: {  //设置坐标轴刻度
                    show: true,  //设置坐标轴刻度是否显示
                    inside: true,  //设置坐标轴刻度是否朝内
                    lengt: 3,  //设置长度
                    lineStyle: {
                        color: 'yellow',  //设置坐标轴刻度的颜色,默认取轴线的颜色
                        width: 1,  //设置坐标轴刻度的线宽
                        type: 'solid',  //设置坐标轴刻度的线型
                    },
                },
                axisLabel: {  //设置坐标轴标签
                    show: true,  //设置坐标轴标签是否显示
                    inside: false,  //设置坐标轴标签是否朝内
                    rotate: 0,  //设置旋转角度
                    margin: 5,
                },  //设置刻度标签与轴线之间的距离
                //color:'red', },  //设置默认取轴线的颜色
                splitLine: {  //设置grid区域中的分隔线
                    show: false,  //设置grid区域中的分隔线是否显示
                    lineStyle: {
                        color: 'red',
                        //width:1,
                        //type:'solid',
                    },
                },
                splitArea: {  //设置网格区域
                    show: false,
                },  //设置网格区域是否显示,默认false
                data: ["1月", "2月", "3月", "4月", "5月", "6月", "7月",
                    "8月", "9月", "10月", "11月", "12月"]
            },
            yAxis: {  //配置y轴坐标系
                show: true,  //设置网格区域是否显示
                position: 'left',  //设置y轴位置
                offset: 0,  //设置y轴相对于默认位置的偏移
                type: 'value',  //设置轴类型,默认'category'
                name: '销量',  //设置轴名称
                nameLocation: 'end',  //设置轴名称相对位置value
                nameTextStyle: {  //设置坐标轴名称样式
                    color: "#fff",
                    padding: [5, 0, 0, 5],
                },  //设置坐标轴名称相对位置
                nameGap: 15,  //设置坐标轴名称与轴线之间的距离
                nameRotate: 0,  //设置坐标轴名字旋转
                axisLine: {  //设置坐标轴轴线
                    show: true,  //设置坐标轴轴线是否显示
                    //-------------------箭头-------------------------
                    symbol: ['none', 'arrow'],  //设置是否显示轴线箭头
                    symbolSize: [8, 8],  //设置箭头大小
                    symbolOffset: [0, 7],  //设置箭头位置
                    lineStyle: {  //设置线
                        color: '#fff',
                        width: 1,
                        type: 'solid',
                    },
                },
                axisTick: {  //设置坐标轴刻度
                    show: true,  //设置坐标轴刻度是否显示
                    inside: true,  //设置坐标轴刻度是否朝内
                    length: 3,  //设置长度
                    lineStyle: {
                        //color:'red',  //设置默认取轴线的颜色
                        width: 1,
                        type: 'solid',
                    },
                },
                axisLabel: {  //设置坐标轴标签
                    show: true,  //设置坐标轴标签是否显示
                    inside: false,  //设置坐标轴标签是否朝内
                    rotate: 0,  //设置旋转角度
                    margin: 8,  //设置刻度标签与轴线之间的距离
                    //color:'red',  //设置默认取轴线的颜色
                },
                splitLine: {  //设置grid区域中的分隔线
                    show: true,  //设置grid区域中的分隔线是否显示
                    lineStyle: {
                        color: '#666',
                        width: 1,
                        type: 'dashed',  //设置类型
                    },
                },
                splitArea: {  //设置格区域
                    show: false,  //设置格区域是否显示,默认false
                },
            },
            series: [{  //配置系列列表,每个系列通过type控制该系列图表类型
                name: '销量',  //设置系列名称
                type: 'bar',  //设置类型
                legendHoverLink: true,  //设置系列是否启用图例hover时的联动高亮
                label: {  //设置图形上的文本标签
                    show: false,
                    position: 'insideTop',  //设置相对位置
                    rotate: 0,  //设置旋转角度
                    color: '#eee',
                },
                itemStyle:{
                        normal:{//设置柱子的样式
                            // barBorderColor:'rgba(0,0,0,0)',//设置柱子边框颜色
                            barBorderColor:'rgba(20,20,0,0.5)',
                            barBorederWidth:5,//设置柱子边框宽度
                            // color:'rgba(0,0,0,0)',//设置柱子颜色
                            color:'rgba(0,220,0,0.8)',
                        },
                        emphasis:{//设置鼠标划过时柱子的样式
                            barBorderColor:'rgba(0,0,0,0)',
                            barBorderWidth:25,
                            color:'rgba(0,0,0,0)'
                        }
                    },
                stack:'总量',//设置堆积图形
                barWidth: '20',  //设置柱形的宽度
                barCategoryGap: '20%',  //设置柱形的间距
                data: [3020, 4800, 3600, 6050, 4320, 6200, 5050, 7200, 4521, 6700, 8000, 5020]
            }]
        };


【推荐】国内首个AI IDE,深度理解中文开发场景,立即下载体验Trae
【推荐】编程新体验,更懂你的AI,立即体验豆包MarsCode编程助手
【推荐】抖音旗下AI助手豆包,你的智能百科全书,全免费不限次数
【推荐】轻量又高性能的 SSH 工具 IShell:AI 加持,快人一步
· 分享一个免费、快速、无限量使用的满血 DeepSeek R1 模型,支持深度思考和联网搜索!
· 基于 Docker 搭建 FRP 内网穿透开源项目(很简单哒)
· ollama系列01:轻松3步本地部署deepseek,普通电脑可用
· 按钮权限的设计及实现
· 25岁的心里话