机器学习篇:sklearn.datasets
sklearn提供了许多包来进行机器学习,只是很多不去了解的话,到使用的时候就会手忙脚乱根本不会去用,所以这里整理一下,这里整理的顺序是个人想要了解的顺序。
在一开始对这个工具毫无概念的话,可以尝试阅读:
1、机器学习篇:sklearn.datasets
官方文档在这里:
将这个作为了解的基础,是因为虽然我们处理具体问题时得到的数据都是具体的数据表,如csv文件之类的。但是在做演示时需要生成各种数据,使用csv则并不方便(有些数据也不方便分享),那么sklearn.datasets这个包却是很重要了。
但其实并不是每一个方法都会用到,所以应该只会重点关注部分方法。
sklearn.datasets模块包括加载数据集的实用程序,包括加载和获取流行参考数据集的方法。它还具有一些人工数据生成器。
1.1 Toy datasets 小型数据集
这些数据数据量少,数据均衡,大多无缺失值异常值并且已经进行了必要的归一化标准化处理,可用于演示,但是在处理现实遇到的数据集却不大一样。

1.1.1 波士顿房价
由于存在一些问题,该数据集已经不建议使用。替代数据集包括加利福尼亚住房数据集(即fetch_california_housing)和艾姆斯住房数据集(fetch_openml(name="house_prices", as_frame=True))。
该数据集用于分类(样品总数506,维度13),包含的属性如下:
-
按城镇 CRIM 人均犯罪率
-
25,000 平方英尺以上的住宅用地的 ZN 比例。
-
INDUS 每镇非零售营业面积比例
-
CHAS Charles River 虚拟变量(= 1 如果道界河流;否则为 0)
-
NOX 一氧化氮浓度(百万分之几)
-
RM 每户平均房间数
-
1940 年之前建造的自住单元的 AGE 比例
-
DIS 与五个波士顿就业中心的加权距离
-
径向公路可达性的 RAD 指数
-
每 10,000 美元的税全价值财产税率
-
PTRATIO 按城镇划分的师生比例
-
B 1000(Bk - 0.63)^2 其中 Bk 是城镇黑人的比例
-
LSTAT % 较低的人口状况
-
MEDV 自住房屋的中值(以 1000 美元计)
# 波士顿房价,已弃用用 #from sklearn.datasets import load_boston #data = load_boston() # 替代方法 import pandas as pd import numpy as np data_url = "http://lib.stat.cmu.edu/datasets/boston" raw_df = pd.read_csv(data_url, sep="\s+", skiprows=22, header=None) data = pd.DataFrame(np.hstack([raw_df.values[::2, :], raw_df.values[1::2, :2]])) target = raw_df.values[1::2, 2]
1.1.2 鸢尾植物数据集[多分类预测]
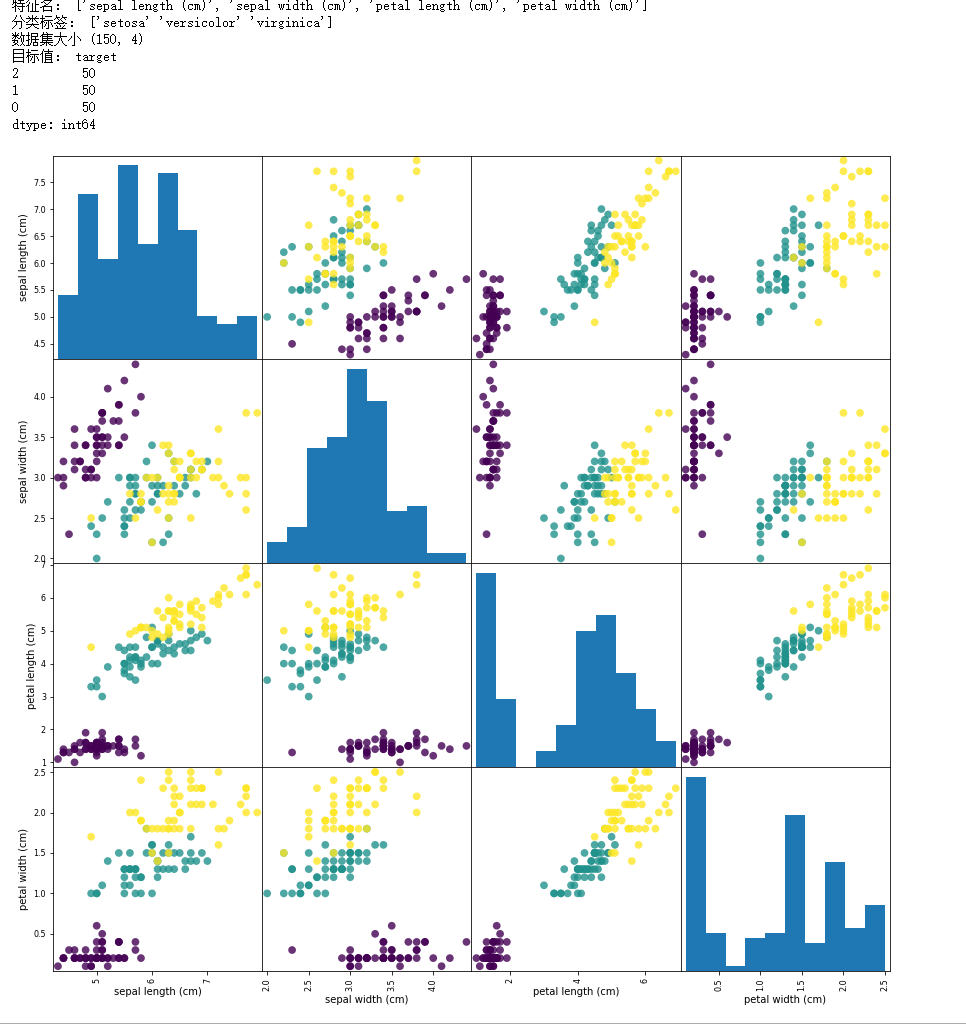
这是比较常见的用于演示分类的数据集。是一个包含三个分类的数据集(Iris-Setosa,Iris-Versicolour,Iris-Virginica)。共150个样本,每个分类的样本数都是50.
# 1.1.2 鸢尾植物数据集 from sklearn.datasets import load_iris import pandas as pd import matplotlib.pyplot as plt iris_data_bunch = load_iris() #print("数据集说明:",iris_data_bunch.DESCR) # 比较详细的数据,很长 print("特征名:",iris_data_bunch.feature_names) print("分类标签:",iris_data_bunch.target_names) iris_data = pd.DataFrame(iris_data_bunch.data,columns=iris_data_bunch.feature_names) iris_target = pd.DataFrame(iris_data_bunch.target,columns=['target']) print("数据集大小",iris_data.shape) print("目标值:",iris_target.value_counts()) # 绘制散点矩阵图 ''' scatter_matrix函数 scatter_matrix(frame, alpha=0.5, c,figsize=None, ax=None, diagonal='hist', marker='.', density_kwds=None,hist_kwds=None, range_padding=0.05, **kwds) frame:pandas dataframe对象 alpha:图像透明度,一般取(0,1] c:颜色 figsize:一英寸为单位的图像大小,一般以元组(width,height)形式设置 ax:Matplotlib轴对象,可选,一般None diagonal:{‘hist’, ‘kde’},在“kde”和“hist”之间选择内核密度估计或对角线上的直方图图 marker: 字符串,可选,Matplotlib标记类型,默认是'.' density_kwds:其他标绘关键字参数,传递给核密度估计标绘 hist_kwds:其他标绘关键字参数,传递给hist函数 range_padding:浮点型,可选x和y轴范围相对于(x_max - x_min)或(y_max - y_min)的相对扩展,默认为0.05 kwds: 其他标绘关键字参数,要传递到散点函数 ''' fig = pd.plotting.scatter_matrix(iris_data,c=iris_data_bunch.target, figsize=(15,15), marker='o', s=60,alpha=0.8)
1.1.3 糖尿病数据集[回归预测]
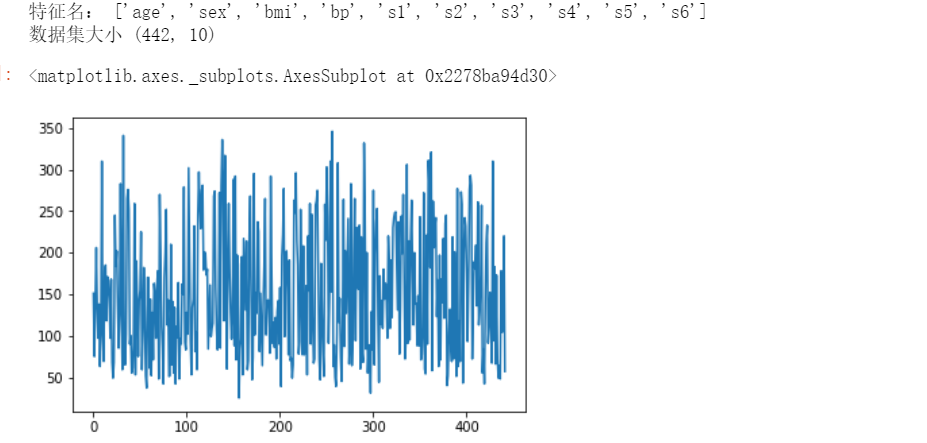
为 n = 442 名糖尿病患者中的每一个获得了 10 个基线变量、年龄、性别、体重指数、平均血压和 6 个血清测量值,以及感兴趣的反应,这是基线后一年疾病进展的定量测量值.
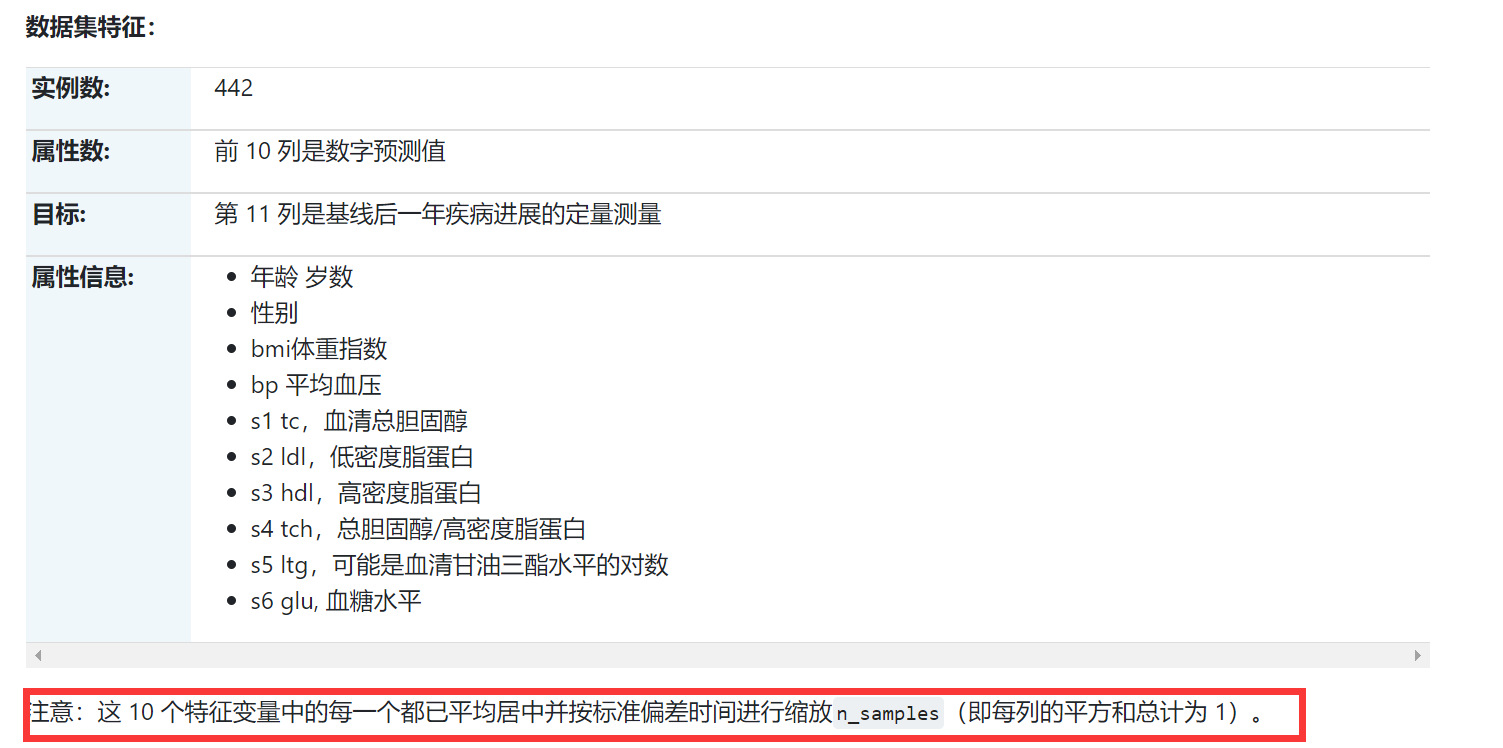
# 1.1.3 糖尿病数据集[回归预测] from sklearn.datasets import load_diabetes import pandas as pd import matplotlib.pyplot as plt diabetes_data_bunch = load_diabetes() #print("数据集说明:",diabetes_data_bunch.DESCR) # 比较详细的数据,很长 print("特征名:",diabetes_data_bunch.feature_names) diabetes_data = pd.DataFrame(diabetes_data_bunch.data,columns=diabetes_data_bunch.feature_names) diabetes_target = pd.DataFrame(diabetes_data_bunch.target,columns=['target']) print("数据集大小",diabetes_data.shape) diabetes_target['target'].plot()
1.1.4 手写数字数据集的光学识别[图像处理,分类]

该数据集包含手写数字的图像:10 个类,其中每个类指一个数字。
NIST 提供的预处理程序用于从预印表格中提取手写数字的规范化位图。在总共 43 人中,有 30 人对训练集做出了贡献,另外 13 人对测试集做出了贡献。32x32 位图被分成 4x4 的非重叠块,并计算每个块中的像素数。这会生成一个 8x8 的输入矩阵,其中每个元素都是 0..16 范围内的整数。这降低了维度并为小失真提供了不变性。
# 1.1.3 手写数字数据集的光学识别[图像处理,分类] from sklearn.datasets import load_digits import pandas as pd import matplotlib.pyplot as plt digits_data_bunch = load_digits() #print("数据集说明:",digits_data_bunch.DESCR) # 比较详细的数据,很长 #print("像素点:",digits_data_bunch.feature_names) #print("图像分类:",digits_data_bunch.target_names) #digits_data_bunch.images与digits_data_bunch.data的区别是,images是1797个8*8的矩阵,data是1797个像素展开64维度 print("image数据形状",digits_data_bunch.images.shape) print("data数据形状",digits_data_bunch.data.shape) print("target数据形状",digits_data_bunch.target.shape) # 绘制部分图像 t=0 n = 10 f = plt.figure() for i in range(digits_data_bunch.target.shape[0]): if digits_data_bunch.target[i]==t: #print(t,i,digits_data_bunch.target[i]) f.add_subplot(1, n, i + 1) plt.imshow(digits_data_bunch.images[i]) t = t+1 if(t>=n): break plt.show(block=True)

1.1.5 Linnerrud 数据集[多输出回归预测]
Linnerud 数据集是一个多输出回归数据集。它由从健身俱乐部的 20 名中年男性收集的三个运动(数据)和三个生理(目标)变量组成:
-
生理学- CSV 包含 20 个对 3 个生理变量的观察:体重、腰围和脉搏。
-
练习- 包含 3 个练习变量的 20 个观察结果的 CSV:下巴、仰卧起坐和跳跃。
# Linnerrud 数据集[多输出回归预测] from sklearn.datasets import load_linnerud import pandas as pd import matplotlib.pyplot as plt linnerud_data_bunch = load_linnerud() #print("数据集说明:",linnerud_data_bunch.DESCR) # 比较详细的数据,很长 print("特征:",linnerud_data_bunch.feature_names) print("预测值:",linnerud_data_bunch.target_names) linnerud_data = pd.DataFrame(linnerud_data_bunch.data,columns=linnerud_data_bunch.feature_names) linnerud_target = pd.DataFrame(linnerud_data_bunch.target,columns=linnerud_data_bunch.target_names) print("数据集大小",linnerud_data.shape) linnerud_target.plot()

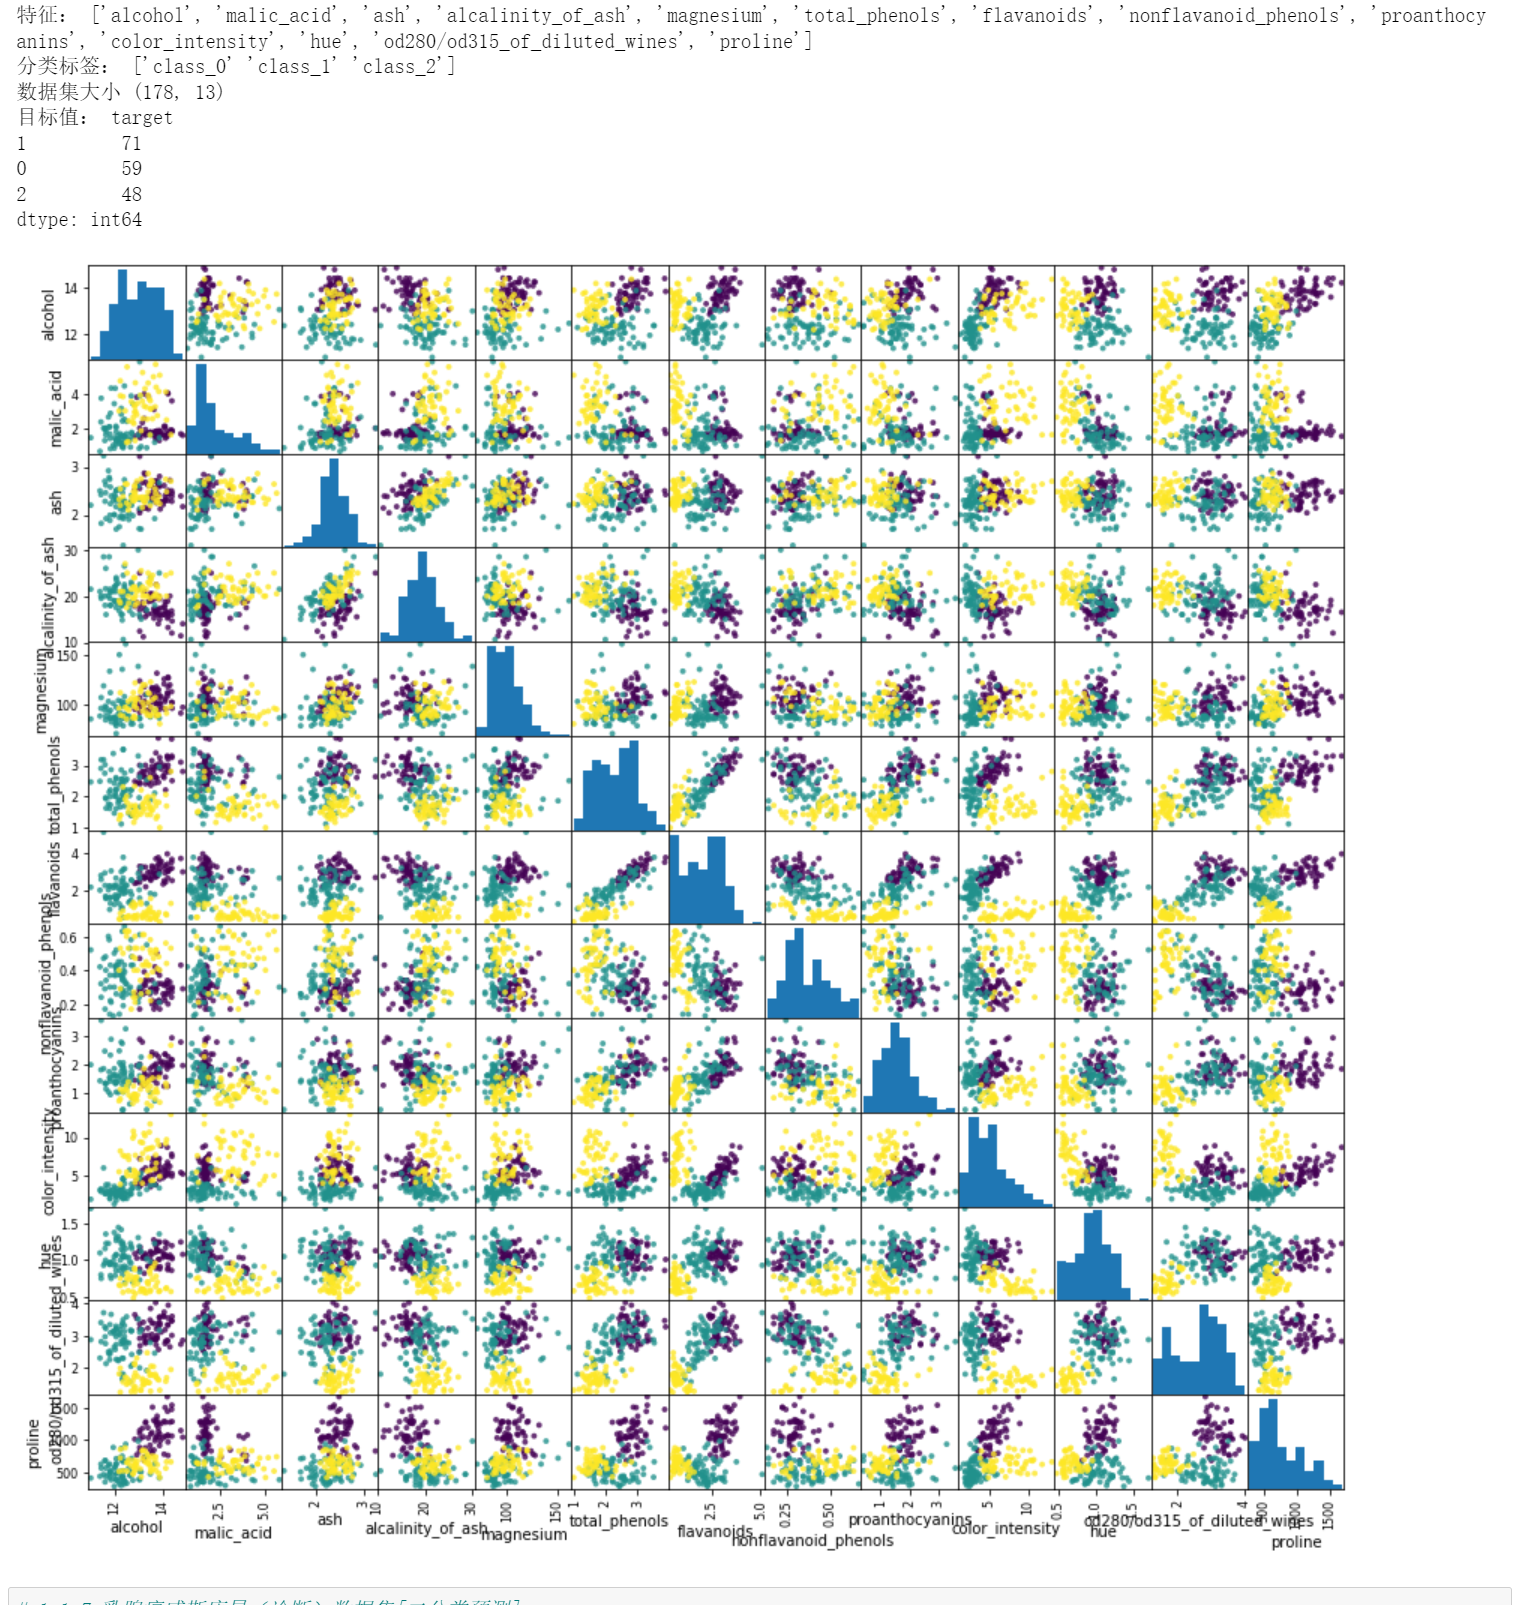
1.1.6 葡萄酒识别数据集[多分类预测]
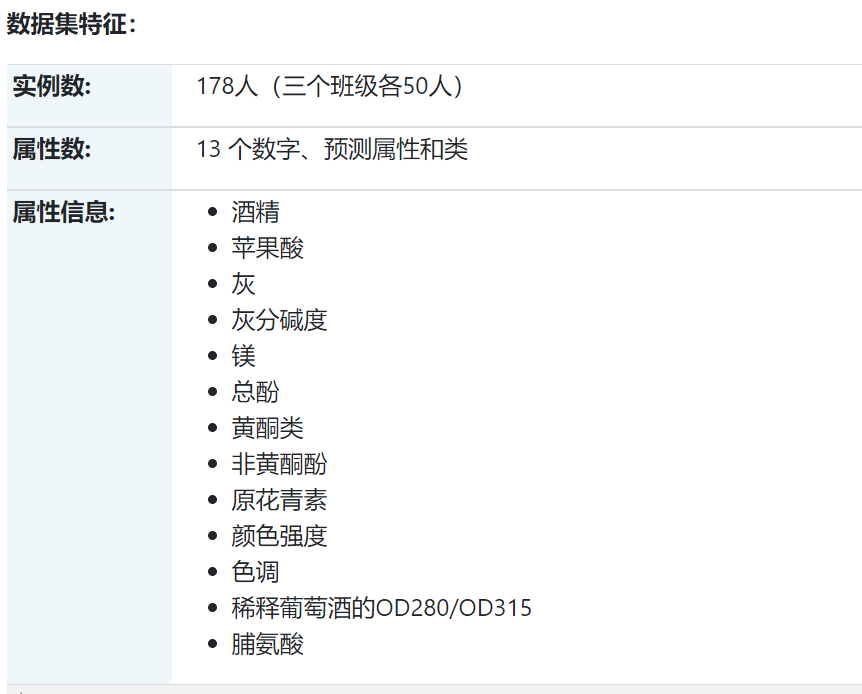
数据是由三个不同的栽培者对意大利同一地区种植的葡萄酒进行化学分析的结果。对三种葡萄酒中的不同成分进行了十三种不同的测量。
# 1.1.6 葡萄酒识别数据集[多分类预测] from sklearn.datasets import load_wine import pandas as pd import matplotlib.pyplot as plt wine_data_bunch = load_wine() #print("数据集说明:",wine_data_bunch.DESCR) # 比较详细的数据,很长 print("特征:",wine_data_bunch.feature_names) print("分类标签:",wine_data_bunch.target_names) wine_data = pd.DataFrame(wine_data_bunch.data,columns=wine_data_bunch.feature_names) wine_target = pd.DataFrame(wine_data_bunch.target,columns=['target']) print("数据集大小",wine_data.shape) print("目标值:",wine_target.value_counts()) # 绘制散点矩阵图 ''' scatter_matrix函数 scatter_matrix(frame, alpha=0.5, c,figsize=None, ax=None, diagonal='hist', marker='.', density_kwds=None,hist_kwds=None, range_padding=0.05, **kwds) frame:pandas dataframe对象 alpha:图像透明度,一般取(0,1] c:颜色 figsize:一英寸为单位的图像大小,一般以元组(width,height)形式设置 ax:Matplotlib轴对象,可选,一般None diagonal:{‘hist’, ‘kde’},在“kde”和“hist”之间选择内核密度估计或对角线上的直方图图 marker: 字符串,可选,Matplotlib标记类型,默认是'.' density_kwds:其他标绘关键字参数,传递给核密度估计标绘 hist_kwds:其他标绘关键字参数,传递给hist函数 range_padding:浮点型,可选x和y轴范围相对于(x_max - x_min)或(y_max - y_min)的相对扩展,默认为0.05 kwds: 其他标绘关键字参数,要传递到散点函数 ''' # 可以观察部分列 cols = [col for col in wine_data.columns.values if col not in ['','']] #cols = [col for col in wine_data.columns.values if col in ['proline','hue']] fig = pd.plotting.scatter_matrix(wine_data[cols],c=wine_data_bunch.target, figsize=(15,15), marker='.', s=60,alpha=0.8)
1.1.7 乳腺癌威斯康星(诊断)数据集[二分类预测]
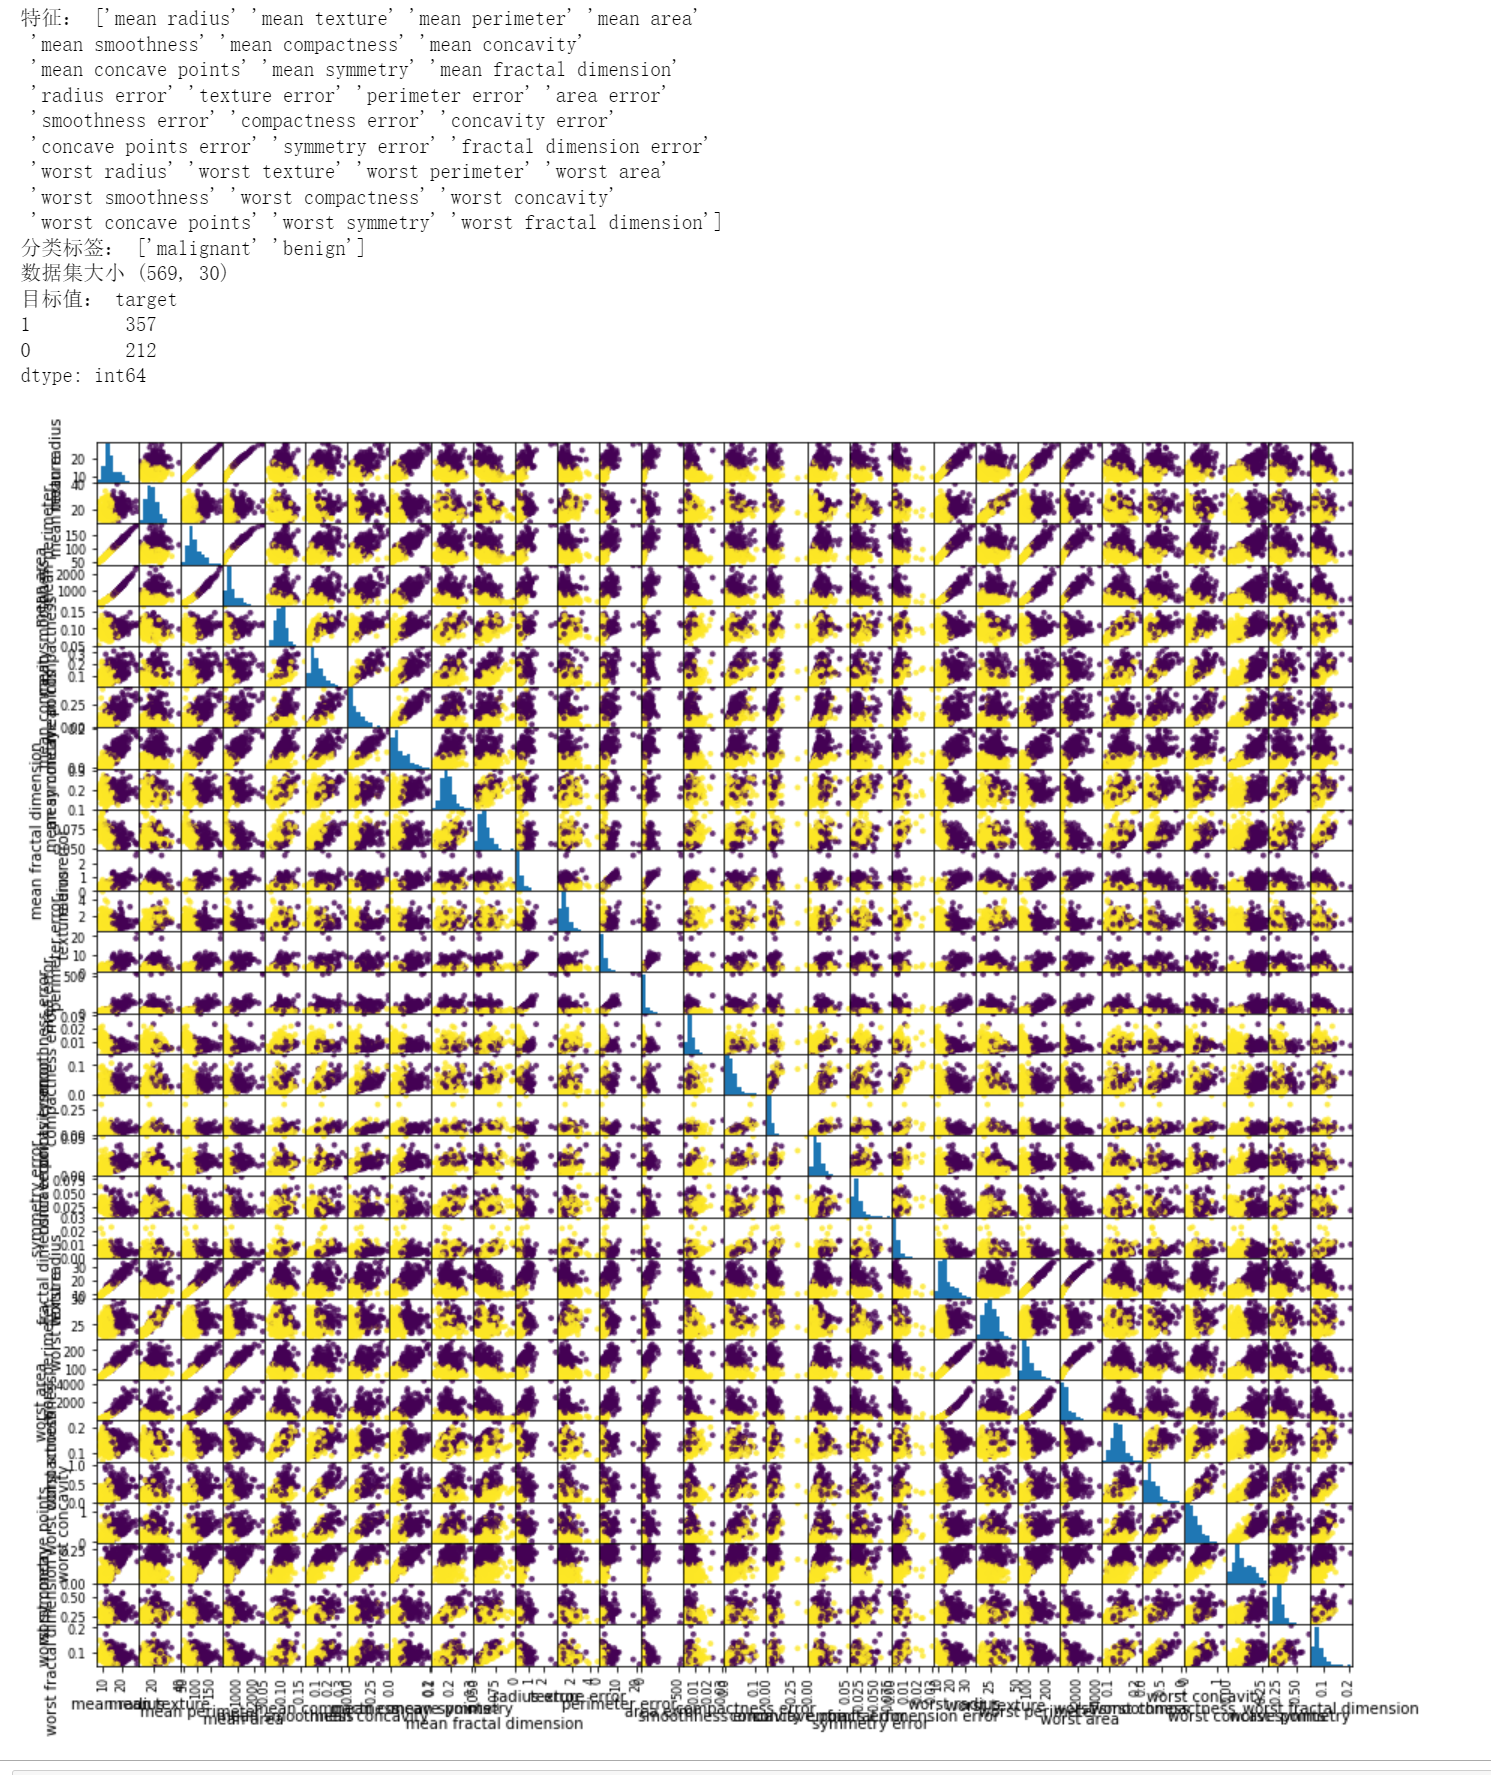
这是 UCI ML 威斯康星州乳腺癌(诊断)数据集的副本。 https://goo.gl/U2Uwz2
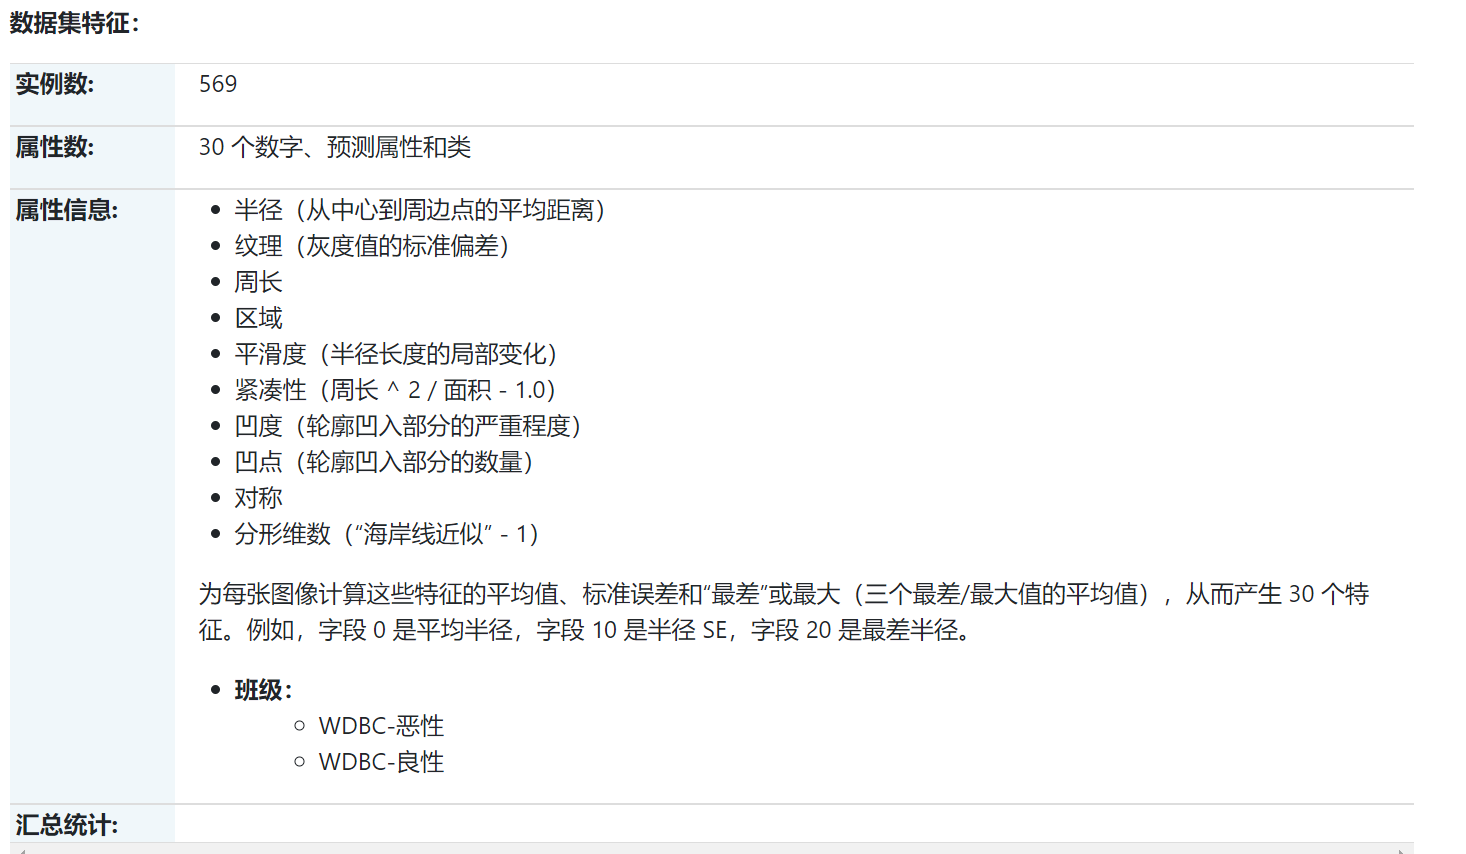
特征是根据乳房肿块的细针穿刺 (FNA) 的数字化图像计算得出的。它们描述了图像中存在的细胞核的特征。
# 1.1.7 乳腺癌威斯康星(诊断)数据集[二分类预测] from sklearn.datasets import load_breast_cancer import pandas as pd import matplotlib.pyplot as plt cancer_data_bunch = load_breast_cancer() #print("数据集说明:",cancer_data_bunch.DESCR) # 比较详细的数据,很长 print("特征:",cancer_data_bunch.feature_names) print("分类标签:",cancer_data_bunch.target_names) cancer_data = pd.DataFrame(cancer_data_bunch.data,columns=cancer_data_bunch.feature_names) cancer_target = pd.DataFrame(cancer_data_bunch.target,columns=['target']) print("数据集大小",cancer_data.shape) print("目标值:",cancer_target.value_counts()) # 绘制散点矩阵图 ''' scatter_matrix函数 scatter_matrix(frame, alpha=0.5, c,figsize=None, ax=None, diagonal='hist', marker='.', density_kwds=None,hist_kwds=None, range_padding=0.05, **kwds) frame:pandas dataframe对象 alpha:图像透明度,一般取(0,1] c:颜色 figsize:一英寸为单位的图像大小,一般以元组(width,height)形式设置 ax:Matplotlib轴对象,可选,一般None diagonal:{‘hist’, ‘kde’},在“kde”和“hist”之间选择内核密度估计或对角线上的直方图图 marker: 字符串,可选,Matplotlib标记类型,默认是'.' density_kwds:其他标绘关键字参数,传递给核密度估计标绘 hist_kwds:其他标绘关键字参数,传递给hist函数 range_padding:浮点型,可选x和y轴范围相对于(x_max - x_min)或(y_max - y_min)的相对扩展,默认为0.05 kwds: 其他标绘关键字参数,要传递到散点函数 ''' # 可以观察部分列 cols = [col for col in cancer_data.columns.values if col not in ['','']] #cols = [col for col in wine_data.columns.values if col in ['proline','hue']] fig = pd.plotting.scatter_matrix(cancer_data[cols],c=cancer_data_bunch.target, figsize=(15,15), marker='.', s=60,alpha=0.8)
1.2 Real world datasets 真实世界数据集
数据涉及复杂的文本处理、图像处理,特征需要进一步进行加工。

1.2.1 Olivetti 人脸数据集
该数据集包含1992 年 4 月至 1994 年 4 月在 AT&T 剑桥实验室拍摄的一组面部图像。该 sklearn.datasets.fetch_olivetti_faces功能是从 AT&T 下载数据档案的数据获取/缓存功能。
如原始网站所述:
40 个不同主题中的每一个都有 10 个不同的图像。对于某些对象,图像是在不同时间拍摄的,改变了灯光、面部表情(睁眼/闭眼、微笑/不微笑)和面部细节(戴眼镜/不戴眼镜)。所有图像都是在黑暗的均匀背景下拍摄的,受试者处于直立的正面位置(对某些侧面运动有容忍度)
该数据库的“目标”是一个从 0 到 39 的整数,表示图中人物的身份;然而,每类只有 10 个示例,从无监督或半监督的角度来看,这个相对较小的数据集更有趣。
# 1.2.1 Olivetti 人脸数据集 from sklearn.datasets import fetch_olivetti_faces import pandas as pd import matplotlib.pyplot as plt faces_data_bunch = fetch_olivetti_faces() faces_data = pd.DataFrame(faces_data_bunch.data) faces_target = pd.DataFrame(faces_data_bunch.target,columns=['target']) # dir(faces_data_bunch) ['DESCR', 'data', 'images', 'target'] print("faces_data_bunch.data的形状",faces_data_bunch.data.shape) print("faces_data_bunch.images的形状",faces_data_bunch.images.shape) #print("faces_data_bunch.target的值:",faces_target.value_counts()) # 有40类(0-39),每一类仅有10个样本 # 绘制部分图像 n = 5 f = plt.figure() for i in range(n): f.add_subplot(1, n, i + 1) plt.imshow(faces_data_bunch.images[i]) plt.show(block=True)

1.2.2 20 个新闻组文本数据集
20 个新闻组数据集包含关于 20 个主题的大约 18000 个新闻组帖子,分为两个子集:一个用于培训(或开发),另一个用于测试(或用于性能评估)。训练集和测试集之间的划分基于特定日期之前和之后发布的消息。
该模块包含两个加载器。第一个, sklearn.datasets.fetch_20newsgroups,返回原始文本列表,可以将其馈送到文本特征提取器,例如CountVectorizer 使用自定义参数以提取特征向量。第二个,sklearn.datasets.fetch_20newsgroups_vectorized,返回随时可用的特征,即不需要使用特征提取器。
在官方文档中有更加详细的描述,在这里并不深入,下面也是官方文档提供的例子。
## 1.2.2 20 个新闻组文本数据集 from sklearn.datasets import fetch_20newsgroups,fetch_20newsgroups_vectorized #help(fetch_20newsgroups) ''' 关注以下参数: subset : {'train', 'test', 'all'}, default='train' categories : 可选择加载的分类,默认是全部 ['alt.atheism', 'comp.graphics', 'comp.os.ms-windows.misc', 'comp.sys.ibm.pc.hardware', 'comp.sys.mac.hardware', 'comp.windows.x', 'misc.forsale', 'rec.autos', 'rec.motorcycles', 'rec.sport.baseball', 'rec.sport.hockey', 'sci.crypt', 'sci.electronics', 'sci.med', 'sci.space', 'soc.religion.christian', 'talk.politics.guns', 'talk.politics.mideast', 'talk.politics.misc', 'talk.religion.misc'] remove: 删除一些无关的元数据('headers', 'footers', 'quotes') #因为这些往往会包含一些分类信息,造成过拟合 ''' # 将文本数据转化成稀疏矩阵 from sklearn.feature_extraction.text import TfidfVectorizer categories = ['alt.atheism', 'talk.religion.misc','comp.graphics', 'sci.space'] newsgroups_train = fetch_20newsgroups(subset='train',categories=categories,remove=('headers', 'footers', 'quotes')) vectorizer = TfidfVectorizer() vectors = vectorizer.fit_transform(newsgroups_train.data) print(vectors.shape,"非0元素占比:",vectors.nnz / float(vectors.shape[0]*vectors.shape[1])) # sklearn.datasets.fetch_20newsgroups_vectorized 是一个返回即用型令牌计数功能而不是文件名的函数。 ## 使用朴素贝叶斯进行预测 from sklearn.naive_bayes import MultinomialNB from sklearn import metrics newsgroups_test = fetch_20newsgroups(subset='test',categories=categories,remove=('headers', 'footers', 'quotes')) vectors_test = vectorizer.transform(newsgroups_test.data) clf = MultinomialNB(alpha=.01) clf.fit(vectors, newsgroups_train.target) pred = clf.predict(vectors_test) metrics.f1_score(newsgroups_test.target, pred, average='macro')
(2034, 26879) 非0元素占比: 0.0035978272269590263
0.7699517518452172
1.2.3 Wild 人脸识别数据集中的 Labeled Faces
本数据集是网上收集的名人JPEG图片的集合,详细信息请见官网:http://vis-www.cs.umass.edu/lfw/
每张照片都以一张脸为中心。典型的任务称为人脸验证:给定一对两张图片,二元分类器必须预测这两张图片是否来自同一个人。
另一种任务,人脸识别或人脸识别是:给定一个未知人的脸部图片,通过参考之前看到的已识别人员图片库来识别此人的姓名。
人脸验证和人脸识别都是通常在经过训练以执行人脸检测的模型的输出上执行的任务。最流行的人脸检测模型称为 Viola-Jones,在 OpenCV 库中实现。LFW 人脸是由这个人脸检测器从各种在线网站中提取的。
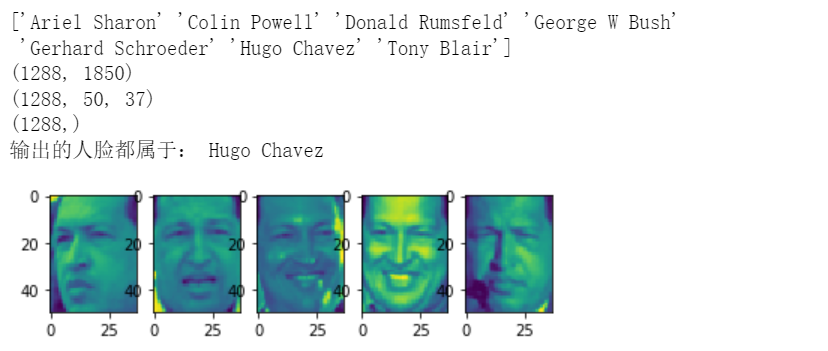
sklearn.datasets提供了两个人脸识别相关的数据集:第一个加载器fetch_lfw_people用于人脸识别任务:多类分类任务(因此是监督学习), 第二个加载器fetch_lfw_pairs通常用于人脸验证任务:每个样本是一对属于或不属于同一个人的两张图片。
# 1.2.3 Wild 人脸识别数据集中的 Labeled Faces ### 第一个加载器,分类学习 from sklearn.datasets import fetch_lfw_people from sklearn.datasets import fetch_olivetti_faces import pandas as pd import matplotlib.pyplot as plt faces_data_bunch = fetch_lfw_people(min_faces_per_person=70, resize=0.4) #color=True则加载RGB彩色通道 print(faces_data_bunch.target_names) print(faces_data_bunch.data.shape) print(faces_data_bunch.images.shape) print(faces_data_bunch.target.shape) # 输出同一个人的人脸 n = 5 tt = 0 t = faces_data_bunch.target[0] print("输出的人脸都属于:",faces_data_bunch.target_names[faces_data_bunch.target[0]]) f = plt.figure() for i in range(faces_data_bunch.target.shape[0]): if faces_data_bunch.target[i] == t: f.add_subplot(1, n, tt + 1) plt.imshow(faces_data_bunch.images[i]) tt = tt+1 if(tt>=n): break plt.show(block=True)
### 第二个加载学习,人脸验证,并未成功 from sklearn.datasets import fetch_lfw_pairs lfw_pairs_train = fetch_lfw_pairs(subset='train') print(lfw_pairs_train.target_names) print(lfw_pairs_train.pairs.shape) print(lfw_pairs_train.data.shape) print(lfw_pairs_train.target.shape)
第二个加载器运行时报错如下,应当是数据集下载是出错,需要手动进行下载,但是这里并不做深入。

1.2.4 森林覆盖类型
该数据集中的样本对应于美国 30×30m 的森林斑块,收集用于预测每个斑块覆盖类型的任务,即树木的优势种。有七种覆盖类型,使其成为一个多类分类问题。每个样本有 54 个特征,在数据集的主页上有描述 。一些特征是布尔指标,而其他特征是离散或连续测量。
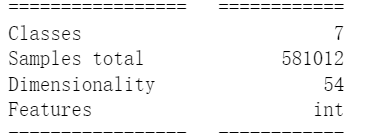
# 1.2.4 森林覆盖类型,报错 from sklearn.datasets import fetch_covtype #help(fetch_covtype) fetch_covtype_bunch = fetch_covtype() print(fetch_covtype_bunch.feature_names) print(fetch_covtype_bunch.data.shape) print(fetch_covtype_bunch.target_names) print(fetch_covtype_bunch.target.shape)
很好,继续报错,看情况可能是数据出了点问题,然后函数加载过程中出现数据量对不上的情况,继续跳过。

1.2.5 RCV1 数据集
路透社语料库第一卷 (RCV1) 是一份包含超过 800,000 个手动分类的新闻专线故事的档案,由 Reuters, Ltd. 提供,用于研究目的。
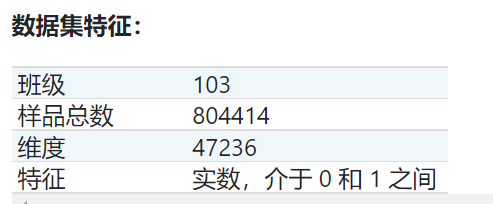
# 1.2.5 RCV1 数据集,由于网络问题,无法验证代码,跳过 from sklearn.datasets import fetch_rcv1 #help(fetch_rcv1) fetch_rcv1_bunch = fetch_rcv1() print(fetch_rcv1_bunch.feature_names) print(fetch_rcv1_bunch.data.shape) print(fetch_rcv1_bunch.target_names) print(fetch_rcv1_bunch.target.shape)
1.2.6 Kddcup 99 数据集
KDD Cup '99 数据集是通过处理由麻省理工学院林肯实验室2创建的 1998 DARPA 入侵检测系统 (IDS) 评估数据集的 tcpdump 部分创建的。人工数据(在数据集主页上有描述)是使用封闭网络和手动注入攻击生成的,以在后台产生大量不同类型的攻击,并且在后台进行正常活动。由于最初的目标是为监督学习算法生成大型训练集,因此有很大比例(80.1%)的异常数据在现实世界中是不切实际的,不适合旨在检测“异常”数据的无监督异常检测, IE:
-
与正常数据有质的不同
-
在观察中占绝大多数。
因此,我们将 KDD 数据集转换为两个不同的数据集:SA 和 SF。
-
SA是通过简单地选择所有正常数据得到的,一小部分异常数据给出了1%的异常比例。
-
SF获得如图3 通过简单地拿起其属性LOGGED_IN为正的数据,从而集中于入侵攻击,这给攻击的0.3%的比例。
-
http 和 smtp 是 SF 的两个子集,对应于等于 'http'(对应于 'smtp')的第三个特征。
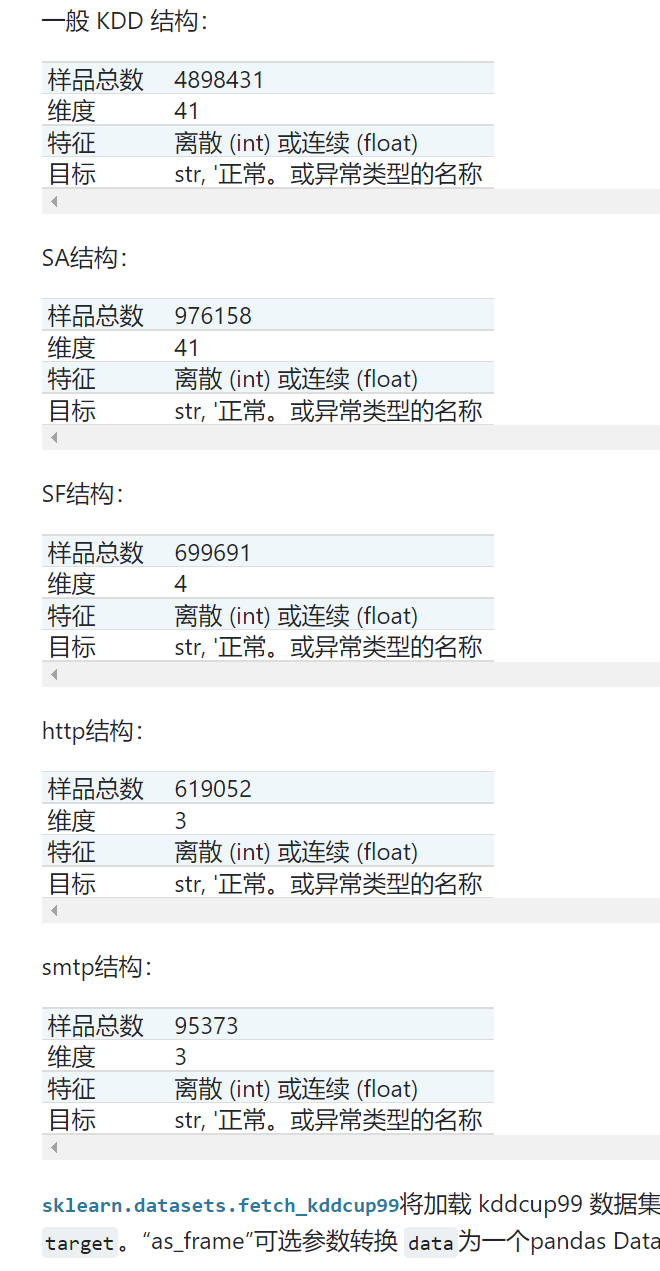
# 1.2.6 Kddcup 99 数据集 from sklearn.datasets import fetch_kddcup99 import pandas as pd import matplotlib.pyplot as plt #help(fetch_kddcup99) fetch_kddcup99_bunch = fetch_kddcup99() print(fetch_kddcup99_bunch.feature_names) print(fetch_kddcup99_bunch.data.shape) print(fetch_kddcup99_bunch.target_names) print(fetch_kddcup99_bunch.target.shape) fetch_kddcup99_data = pd.DataFrame(fetch_kddcup99_bunch.data,columns=fetch_kddcup99_bunch.feature_names) fetch_kddcup99_target = pd.DataFrame(fetch_kddcup99_bunch.target,columns=fetch_kddcup99_bunch.target_names) fetch_kddcup99_target.value_counts
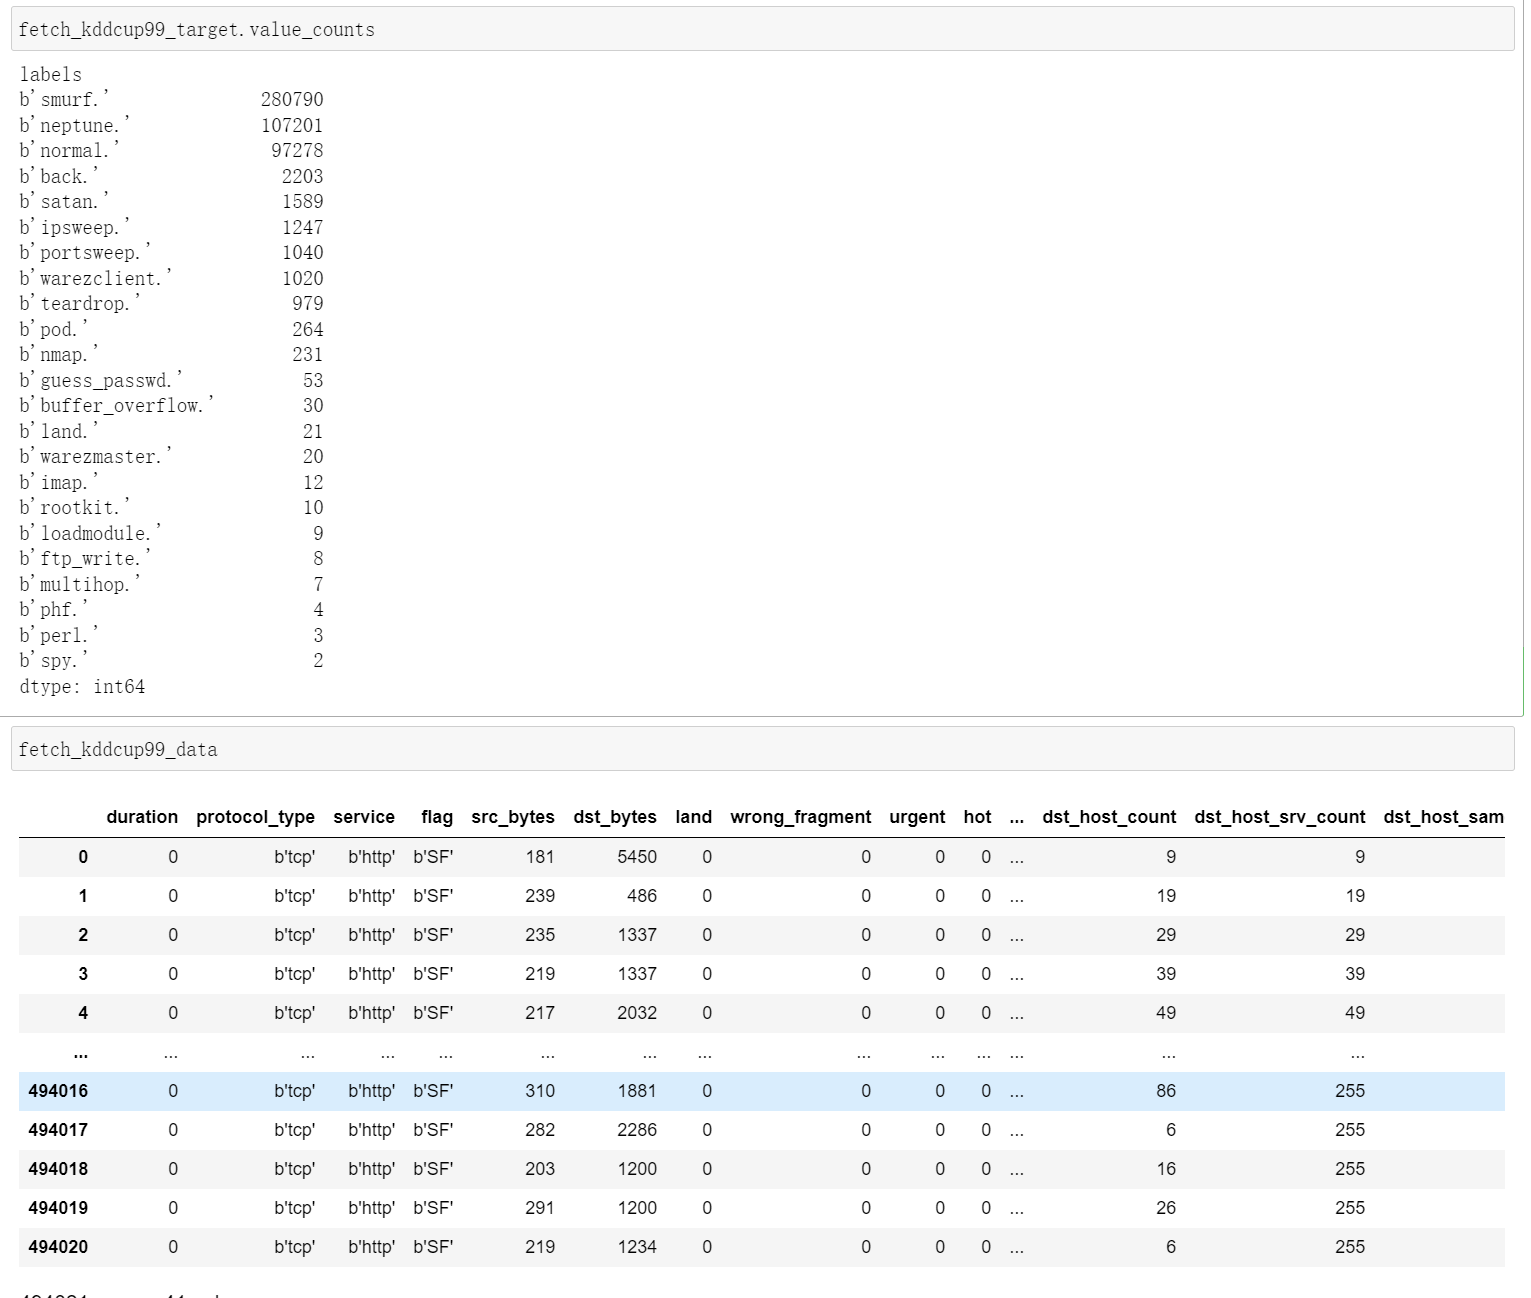
1.2.7 加州住房数据集
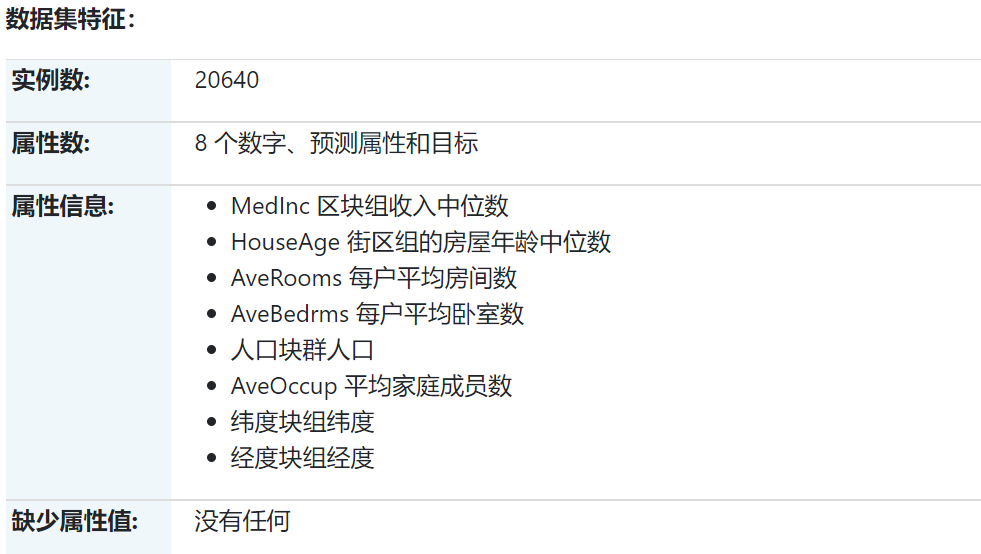
该数据集是从 StatLib 存储库中获得的。 https://www.dcc.fc.up.pt/~ltorgo/Regression/cal_housing.html
目标变量是加利福尼亚地区的房屋价值中位数,以数十万美元(100,000 美元)表示。
该数据集源自 1990 年美国人口普查,每个人口普查区块组使用一行。街区组是美国人口普查局发布样本数据的最小地理单位(街区组的人口通常为 600 至 3,000 人)。
家庭是居住在一个家庭中的一群人。由于此数据集中的房间和卧室的平均数量是按家庭提供的,因此对于家庭少而空屋多的街区组(例如度假胜地),这些列可能会采用大得惊人的值。
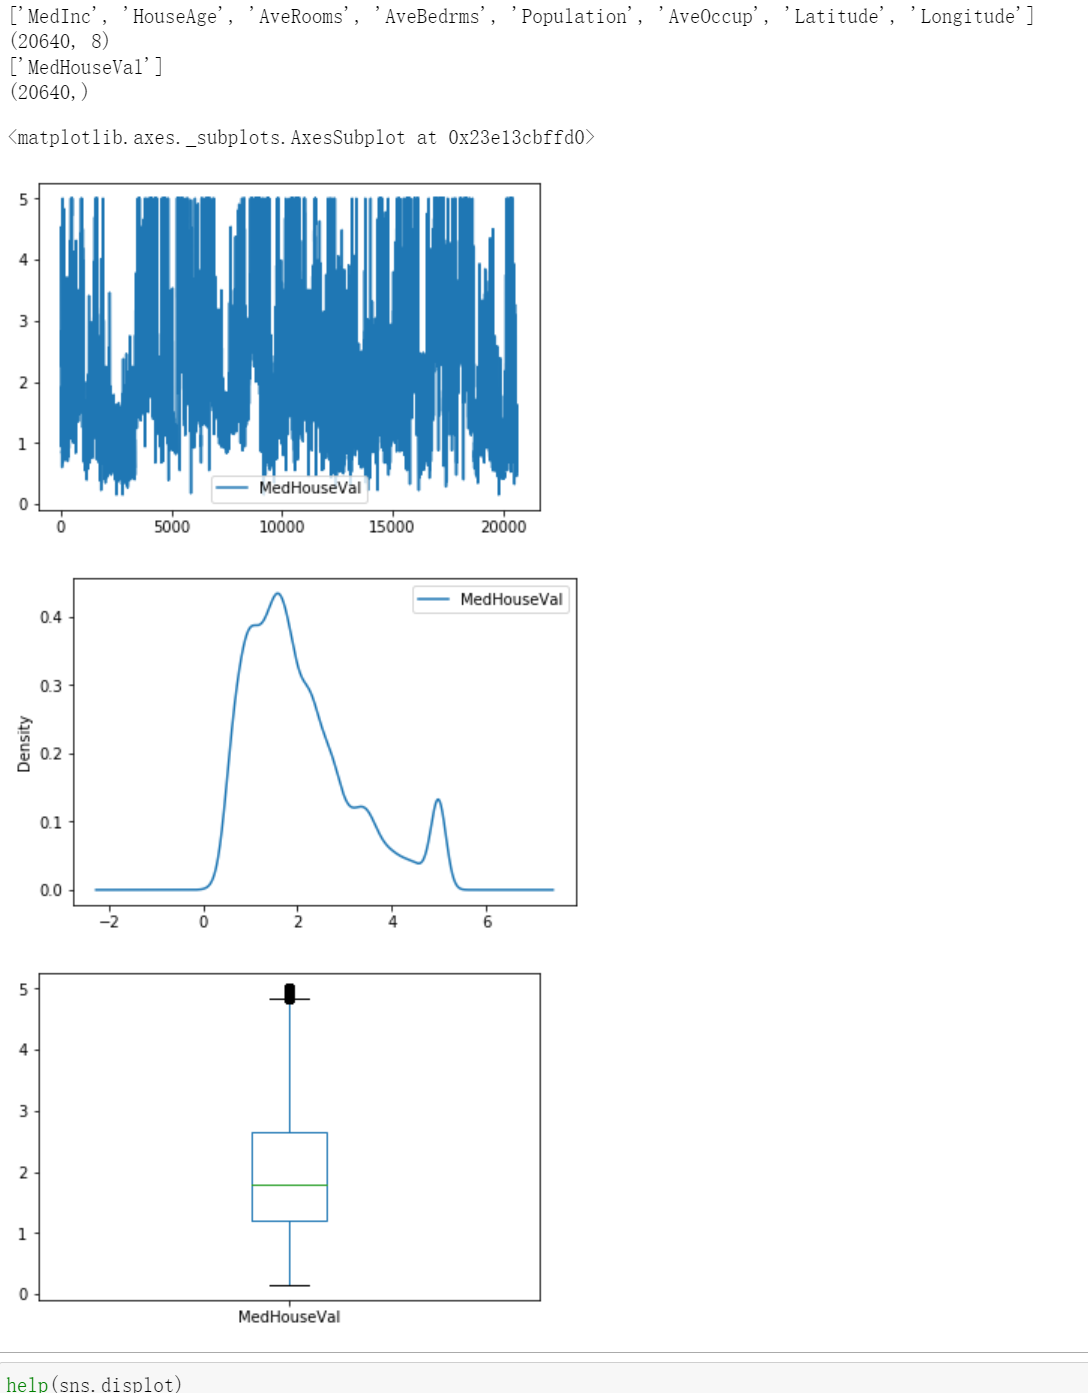
# 1.2.7 加州住房数据集 from sklearn.datasets import fetch_california_housing import pandas as pd import seaborn as sns import matplotlib.pyplot as plt #help(fetch_california_housing) housing_bunch = fetch_california_housing() print(housing_bunch.feature_names) print(housing_bunch.data.shape) print(housing_bunch.target_names) print(housing_bunch.target.shape) housing_data = pd.DataFrame(housing_bunch.data,columns=housing_bunch.feature_names) housing_target = pd.DataFrame(housing_bunch.target,columns=housing_bunch.target_names) ### 绘图 # 核密度曲线 ''' sns.displot(data = housing_target['MedHouseVal'], # 指定绘图数据 kind = 'hist', #hist,kde,ecdf kde=True, # 绘制密度曲线 rug=True, # 绘制 rug 图(变量分布) ) plt.show(block=True) ''' # 折线图 housing_target.plot() # 核密度曲线 housing_target.plot(kind='kde') # 箱线图 housing_target.plot(kind='box')
1.3 Generated datasets 生成数据集

1.3.1 分类聚类生成器
1.3.1.1 单标签
二者make_blobs并make_classification通过分配每个类的一个或点的更常分布式集群创建多类数据集。 make_blobs对每个聚类的中心和标准偏差提供更好的控制,并用于演示聚类。 make_classification专门通过以下方式引入噪声:相关的、冗余的和无信息的特征;每个类有多个高斯簇;和特征空间的线性变换。
make_gaussian_quantiles将单个高斯簇划分为由同心超球面分隔的大小接近的类。 make_hastie_10_2生成一个类似的二元 10 维问题。
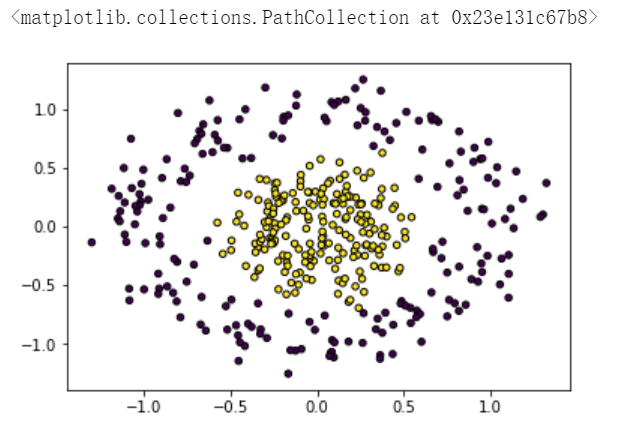
make_circles并make_moons生成对某些算法(例如基于质心的聚类或线性分类)具有挑战性的二维二进制分类数据集,包括可选的高斯噪声。它们对于可视化很有用。make_circles产生具有球面决策边界的高斯数据用于二元分类,同时 make_moons产生两个交错的半圆。
-
make_blobs
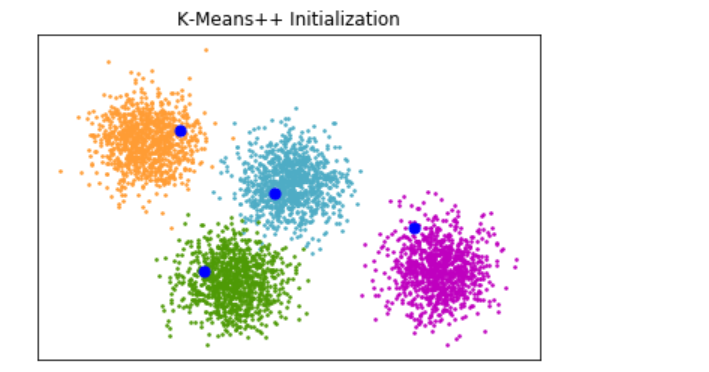
make_blobs方法的例子在官方文档有给出,可直接找到合适的使用:
SEED = 666 # 1.3.1 分类聚类生成器 # 1.3.1.1 单标签 from sklearn.cluster import kmeans_plusplus from sklearn.datasets import make_blobs import matplotlib.pyplot as plt # Generate sample data n_samples = 4000 n_components = 4 X, y_true = make_blobs( n_samples=n_samples, centers=n_components, cluster_std=0.60, random_state=0 ) X = X[:, ::-1] # Calculate seeds from kmeans++ centers_init, indices = kmeans_plusplus(X, n_clusters=4, random_state=0) # Plot init seeds along side sample data plt.figure(1) colors = ["#4EACC5", "#FF9C34", "#4E9A06", "m"] for k, col in enumerate(colors): cluster_data = y_true == k plt.scatter(X[cluster_data, 0], X[cluster_data, 1], c=col, marker=".", s=10) plt.scatter(centers_init[:, 0], centers_init[:, 1], c="b", s=50) plt.title("K-Means++ Initialization") plt.xticks([]) plt.yticks([]) plt.show()
-
make_classification
from sklearn.datasets import make_classification

SEED = 666
X, y = make_classification(n_samples=10000, # 样本个数
n_features=25, # 特征个数
n_informative=3, # 有效特征个数
n_redundant=2, # 冗余特征个数(有效特征的随机组合)
n_repeated=0, # 重复特征个数(有效特征和冗余特征的随机组合)
n_classes=3, # 样本类别
n_clusters_per_class=1, # 簇的个数
random_state=SEED)

'''
其中多分类数据可通过更改n_classes=n的值来进行构建
但是参数限制:n_classes*n_clusters_per_class<=n_informative,n_informative+n_redundant<=n_features

'''
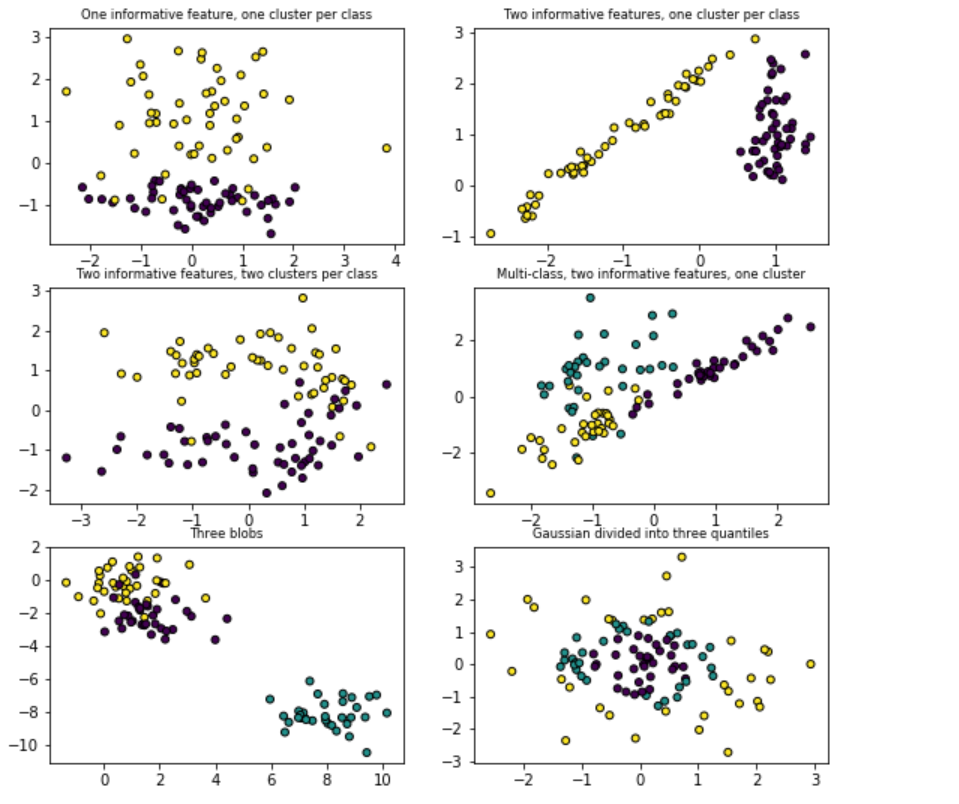
make_classification方法的例子在官方文档有给出,可直接找到合适的使用:使用示例
import matplotlib.pyplot as plt from sklearn.datasets import make_classification from sklearn.datasets import make_blobs from sklearn.datasets import make_gaussian_quantiles plt.figure(figsize=(8, 8)) plt.subplots_adjust(bottom=0.05, top=0.9, left=0.05, right=0.95) plt.subplot(321) plt.title("One informative feature, one cluster per class", fontsize="small") X1, Y1 = make_classification( n_features=2, n_redundant=0, n_informative=1, n_clusters_per_class=1 ) plt.scatter(X1[:, 0], X1[:, 1], marker="o", c=Y1, s=25, edgecolor="k") plt.subplot(322) plt.title("Two informative features, one cluster per class", fontsize="small") X1, Y1 = make_classification( n_features=2, n_redundant=0, n_informative=2, n_clusters_per_class=1 ) plt.scatter(X1[:, 0], X1[:, 1], marker="o", c=Y1, s=25, edgecolor="k") plt.subplot(323) plt.title("Two informative features, two clusters per class", fontsize="small") X2, Y2 = make_classification(n_features=2, n_redundant=0, n_informative=2) plt.scatter(X2[:, 0], X2[:, 1], marker="o", c=Y2, s=25, edgecolor="k") plt.subplot(324) plt.title("Multi-class, two informative features, one cluster", fontsize="small") X1, Y1 = make_classification( n_features=2, n_redundant=0, n_informative=2, n_clusters_per_class=1, n_classes=3 ) plt.scatter(X1[:, 0], X1[:, 1], marker="o", c=Y1, s=25, edgecolor="k") plt.subplot(325) plt.title("Three blobs", fontsize="small") X1, Y1 = make_blobs(n_features=2, centers=3) plt.scatter(X1[:, 0], X1[:, 1], marker="o", c=Y1, s=25, edgecolor="k") plt.subplot(326) plt.title("Gaussian divided into three quantiles", fontsize="small") X1, Y1 = make_gaussian_quantiles(n_features=2, n_classes=3) plt.scatter(X1[:, 0], X1[:, 1], marker="o", c=Y1, s=25, edgecolor="k") plt.show()
-
make_gaussian_quantiles前一个例子中最后一个图便是make_gaussian_quantiles生成的结果。
# Author: Noel Dawe <noel.dawe@gmail.com> # # License: BSD 3 clause import numpy as np import matplotlib.pyplot as plt from sklearn.ensemble import AdaBoostClassifier from sklearn.tree import DecisionTreeClassifier from sklearn.datasets import make_gaussian_quantiles # Construct dataset X1, y1 = make_gaussian_quantiles( cov=2.0, n_samples=200, n_features=2, n_classes=2, random_state=1 ) X2, y2 = make_gaussian_quantiles( mean=(3, 3), cov=1.5, n_samples=300, n_features=2, n_classes=2, random_state=1 ) X = np.concatenate((X1, X2)) y = np.concatenate((y1, -y2 + 1)) # Create and fit an AdaBoosted decision tree bdt = AdaBoostClassifier( DecisionTreeClassifier(max_depth=1), algorithm="SAMME", n_estimators=200 ) bdt.fit(X, y) plot_colors = "br" plot_step = 0.02 class_names = "AB" plt.figure(figsize=(10, 5)) # Plot the decision boundaries plt.subplot(121) x_min, x_max = X[:, 0].min() - 1, X[:, 0].max() + 1 y_min, y_max = X[:, 1].min() - 1, X[:, 1].max() + 1 xx, yy = np.meshgrid( np.arange(x_min, x_max, plot_step), np.arange(y_min, y_max, plot_step) ) Z = bdt.predict(np.c_[xx.ravel(), yy.ravel()]) Z = Z.reshape(xx.shape) cs = plt.contourf(xx, yy, Z, cmap=plt.cm.Paired) plt.axis("tight") # Plot the training points for i, n, c in zip(range(2), class_names, plot_colors): idx = np.where(y == i) plt.scatter( X[idx, 0], X[idx, 1], c=c, cmap=plt.cm.Paired, s=20, edgecolor="k", label="Class %s" % n, ) plt.xlim(x_min, x_max) plt.ylim(y_min, y_max) plt.legend(loc="upper right") plt.xlabel("x") plt.ylabel("y") plt.title("Decision Boundary") # Plot the two-class decision scores twoclass_output = bdt.decision_function(X) plot_range = (twoclass_output.min(), twoclass_output.max()) plt.subplot(122) for i, n, c in zip(range(2), class_names, plot_colors): plt.hist( twoclass_output[y == i], bins=10, range=plot_range, facecolor=c, label="Class %s" % n, alpha=0.5, edgecolor="k", ) x1, x2, y1, y2 = plt.axis() plt.axis((x1, x2, y1, y2 * 1.2)) plt.legend(loc="upper right") plt.ylabel("Samples") plt.xlabel("Score") plt.title("Decision Scores") plt.tight_layout() plt.subplots_adjust(wspace=0.35) plt.show()

-
make_hastie_10_2这里也有给出一些包含了模型学习过程的例子:
import numpy as np import pandas as pd import matplotlib.pyplot as plt from sklearn import ensemble from sklearn import datasets SEED = 666 X, y = datasets.make_hastie_10_2(n_samples=12000, random_state=SEED) print(X.shape) print(pd.DataFrame(y).value_counts())
-
make_circles这是例子:
import numpy as np
import matplotlib.pyplot as plt
from sklearn.datasets import make_circles

SEED = 666
np.random.seed(SEED)

X, y = make_circles(n_samples=400, factor=0.3, noise=0.15)

plt.scatter(X[:, 0], X[:, 1], c=y, s=20, edgecolor="k")
-
make_moons这是例子:
import numpy as np
import matplotlib.pyplot as plt
from sklearn.datasets import make_moons

SEED = 666
np.random.seed(SEED)

X, y = make_moons(n_samples=400, noise=0.15,random_state =True)

plt.scatter(X[:, 0], X[:, 1], c=y, s=20, edgecolor="k")

1.3.1,2 多标签
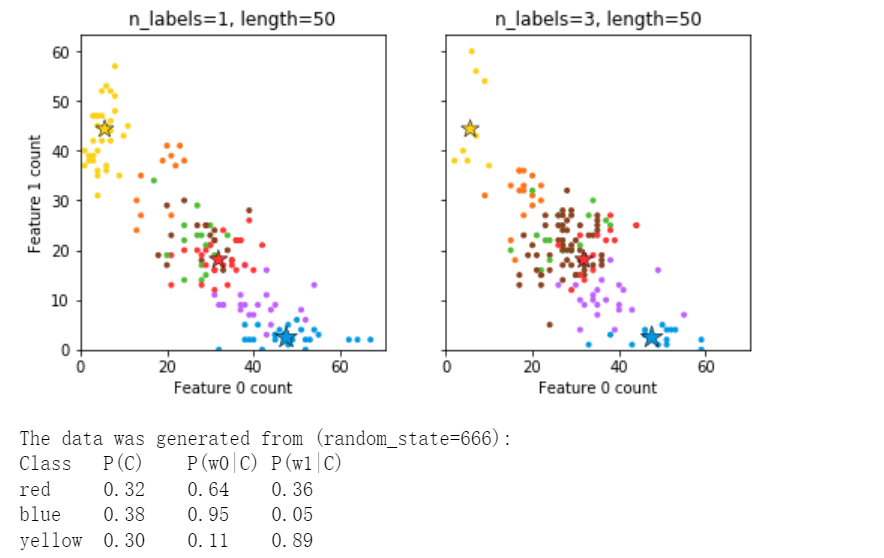
make_multilabel_classification生成具有多个标签的随机样本,反映从混合主题中提取的词袋。每个文档的主题数是从泊松分布中抽取的,主题本身是从固定随机分布中抽取的。类似地,单词数从泊松中提取,单词从多项式中提取,其中每个主题定义了单词的概率分布。关于真正的词袋混合的简化包括:
-
每个主题的词分布是独立绘制的,实际上所有这些都会受到稀疏基分布的影响,并且会相互关联。
-
对于从多个主题生成的文档,所有主题在生成其词袋时的权重相等。
-
没有标签的文档是随机的,而不是来自基本分布。
## 其他例子:https://scikit-learn.org/stable/modules/generated/sklearn.datasets.make_multilabel_classification.html#examples-using-sklearn-datasets-make-multilabel-classification import numpy as np import matplotlib.pyplot as plt from sklearn.datasets import make_multilabel_classification as make_ml_clf COLORS = np.array( [ "!", "#FF3333", # red "#0198E1", # blue "#BF5FFF", # purple "#FCD116", # yellow "#FF7216", # orange "#4DBD33", # green "#87421F", # brown ] ) # Use same random seed for multiple calls to make_multilabel_classification to # ensure same distributions RANDOM_SEED = 666 def plot_2d(ax, n_labels=1, n_classes=3, length=50): X, Y, p_c, p_w_c = make_ml_clf( n_samples=150, n_features=2, n_classes=n_classes, n_labels=n_labels, length=length, allow_unlabeled=False, return_distributions=True, random_state=RANDOM_SEED, ) ax.scatter( X[:, 0], X[:, 1], color=COLORS.take((Y * [1, 2, 4]).sum(axis=1)), marker="." ) ax.scatter( p_w_c[0] * length, p_w_c[1] * length, marker="*", linewidth=0.5, edgecolor="black", s=20 + 1500 * p_c ** 2, color=COLORS.take([1, 2, 4]), ) ax.set_xlabel("Feature 0 count") return p_c, p_w_c _, (ax1, ax2) = plt.subplots(1, 2, sharex="row", sharey="row", figsize=(8, 4)) plt.subplots_adjust(bottom=0.15) p_c, p_w_c = plot_2d(ax1, n_labels=1) ax1.set_title("n_labels=1, length=50") ax1.set_ylabel("Feature 1 count") plot_2d(ax2, n_labels=3) ax2.set_title("n_labels=3, length=50") ax2.set_xlim(left=0, auto=True) ax2.set_ylim(bottom=0, auto=True) plt.show() print("The data was generated from (random_state=%d):" % RANDOM_SEED) print("Class", "P(C)", "P(w0|C)", "P(w1|C)", sep="\t") for k, p, p_w in zip(["red", "blue", "yellow"], p_c, p_w_c.T): print("%s\t%0.2f\t%0.2f\t%0.2f" % (k, p, p_w[0], p_w[1]))
1.3.1.3 双聚类
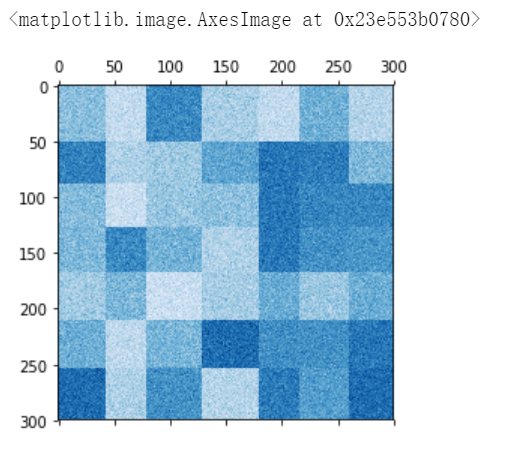
# 例子:https://scikit-learn.org/stable/auto_examples/bicluster/plot_spectral_coclustering.html#sphx-glr-auto-examples-bicluster-plot-spectral-coclustering-py import numpy as np from matplotlib import pyplot as plt from sklearn.datasets import make_biclusters SEED = 666 data, rows, columns = make_biclusters( shape=(300, 300), n_clusters=5, noise=50, shuffle=False, random_state=SEED ) plt.matshow(data, cmap=plt.cm.Blues) #plt.imshow(data, cmap=plt.cm.Blues)

# 例子:https://scikit-learn.org/stable/auto_examples/bicluster/plot_spectral_biclustering.html#sphx-glr-auto-examples-bicluster-plot-spectral-biclustering-py import numpy as np from matplotlib import pyplot as plt from sklearn.datasets import make_checkerboard SEED = 666 data, rows, columns = make_checkerboard( shape=(300, 300), n_clusters=7, noise=10, shuffle=False, random_state=SEED ) plt.matshow(data, cmap=plt.cm.Blues) #plt.imshow(data, cmap=plt.cm.Blues)
1.3.2 回归生成器
make_regression产生回归目标作为随机特征的可选稀疏随机线性组合,带有噪声。它的信息特征可能是不相关的,或者是低等级的(很少有特征占了大部分的方差)。
其他回归生成器根据随机特征确定性地生成函数。 make_sparse_uncorrelated将目标生成为具有固定系数的四个特征的线性组合。其他人明确编码非线性关系:make_friedman1通过多项式和正弦变换相关; make_friedman2包括特征乘法和往复;并且 make_friedman3与目标上的反正切变换类似。
这四个方法的官方文档例子如下:
from sklearn.model_selection import train_test_split from sklearn.datasets import make_regression,make_sparse_uncorrelated,make_friedman1,make_friedman2,make_friedman3 from sklearn.linear_model import Lasso,LinearRegression from sklearn.ensemble import GradientBoostingRegressor import numpy as np SEED = 666 n_samples, n_features = 1000, 20 rng = np.random.RandomState(SEED) # make_regression X, y = make_regression(n_samples, n_features, random_state=rng) sample_weight = rng.rand(n_samples) X_train, X_test, y_train, y_test, sw_train, sw_test = train_test_split( X, y, sample_weight, random_state=rng ) reg = Lasso() reg.fit(X_train, y_train, sample_weight=sw_train) print("make_regression+Lasso:",reg.score(X_test, y_test, sw_test)) # make_sparse_uncorrelated X, y = make_sparse_uncorrelated(n_samples, n_features, random_state=rng) sample_weight = rng.rand(n_samples) X_train, X_test, y_train, y_test, sw_train, sw_test = train_test_split( X, y, sample_weight, random_state=rng ) reg = LinearRegression() reg.fit(X_train, y_train, sample_weight=sw_train) print("make_sparse_uncorrelated+LinearRegression:",reg.score(X_test, y_test, sw_test)) # make_friedman1 X, y = make_friedman1(n_samples, n_features, random_state=rng) sample_weight = rng.rand(n_samples) X_train, X_test, y_train, y_test, sw_train, sw_test = train_test_split( X, y, sample_weight, random_state=rng ) reg = GradientBoostingRegressor() reg.fit(X_train, y_train) print("make_friedman1+GradientBoostingRegressor:",reg.score(X_test, y_test, sw_test)) # make_friedman2 X, y = make_friedman2(n_samples, random_state=rng) sample_weight = rng.rand(n_samples) X_train, X_test, y_train, y_test, sw_train, sw_test = train_test_split( X, y, sample_weight, random_state=rng ) reg = GradientBoostingRegressor() reg.fit(X_train, y_train, sample_weight=sw_train) print("make_friedman2+GradientBoostingRegressor:",reg.score(X_test, y_test, sw_test)) # make_friedman3 X, y = make_friedman3(n_samples, random_state=rng) sample_weight = rng.rand(n_samples) X_train, X_test, y_train, y_test, sw_train, sw_test = train_test_split( X, y, sample_weight, random_state=rng ) reg = GradientBoostingRegressor() reg.fit(X_train, y_train, sample_weight=sw_train) print("make_friedman3+GradientBoostingRegressor:",reg.score(X_test, y_test, sw_test))
make_regression+Lasso: 0.9996730490577503
make_sparse_uncorrelated+LinearRegression: 0.9152203384384905
make_friedman1+GradientBoostingRegressor: 0.9539926353016269
make_friedman2+GradientBoostingRegressor: 0.9924393319722556
make_friedman3+GradientBoostingRegressor: 0.9459741793457287
1.3.3 流形学习生成器
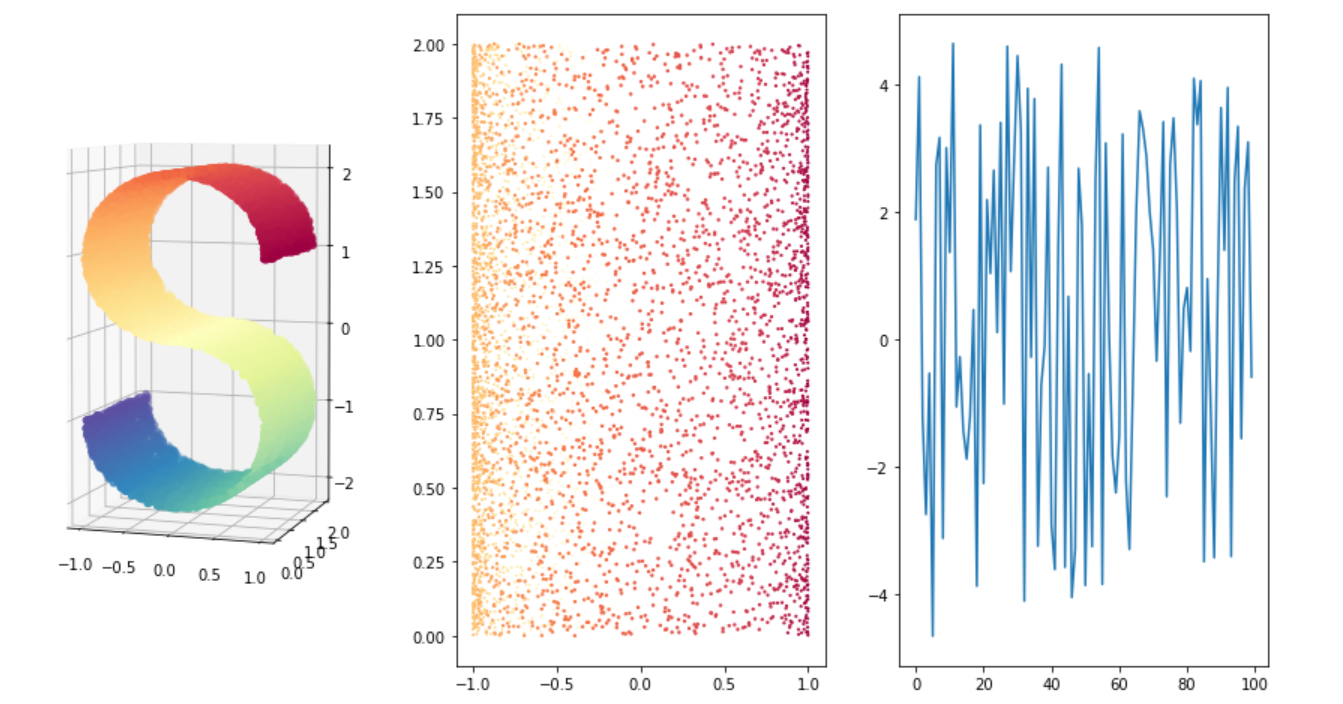
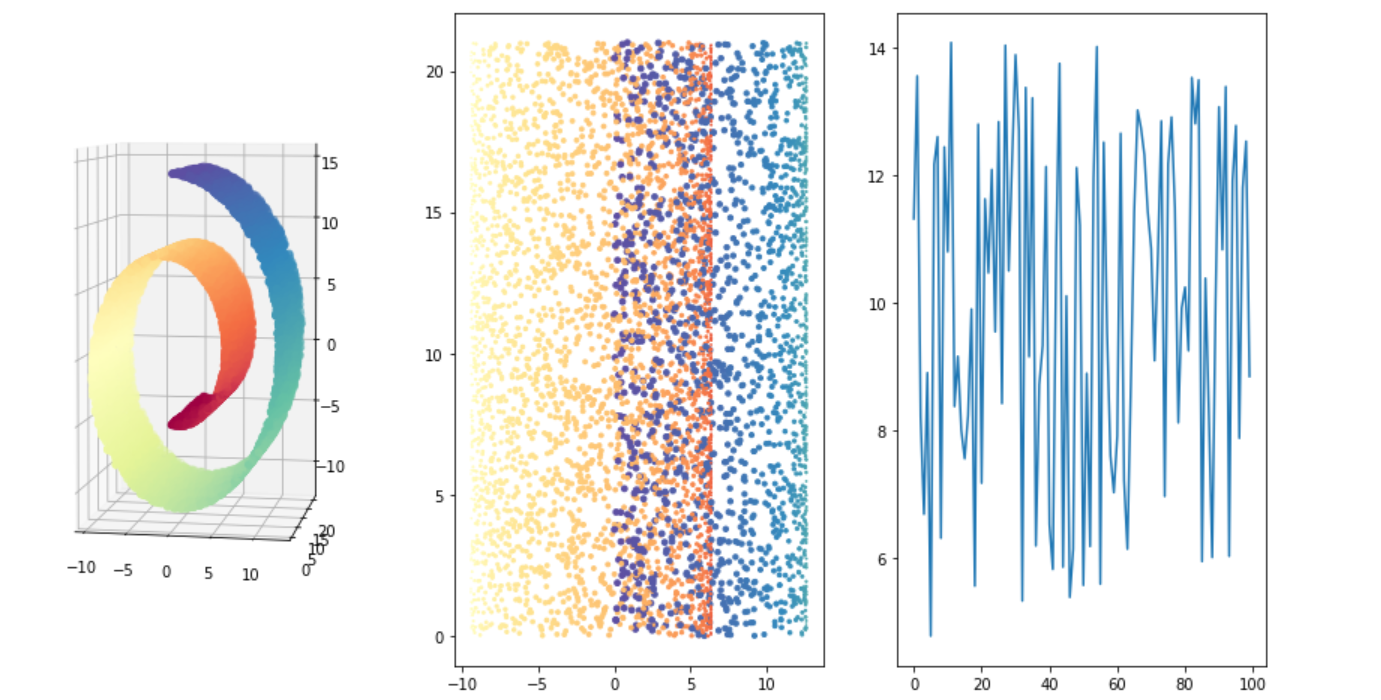
1.3.3.1 make_s_curve S型曲线
# 1.3.3 流形学习生成器 # 1.3.3.1 make_s_curve from sklearn.datasets import make_s_curve from matplotlib import pyplot as plt from mpl_toolkits.mplot3d import Axes3D #导入3D绘图 Axes3D SEED = 666 X, color = make_s_curve(n_samples =10000, noise=0 , random_state=SEED) fig = plt.figure(figsize=(15, 8)) # 3D绘图 ax = fig.add_subplot(131, projection="3d") ax.scatter(X[:, 0], X[:, 1], X[:, 2], c=color, cmap=plt.cm.Spectral) ax.view_init(4, -72) #转换观察3D坐标系的视角 # 2D绘图 ax = fig.add_subplot(132) ax.scatter(X[:, 0], X[:, 1], X[:, 2], c=color, cmap=plt.cm.Spectral) # 绘制一下color的折线图 ax = fig.add_subplot(133) index = range(0,color.shape[0],100) ax.plot(color[index]) plt.show()
1.3.3.2 make_swiss_roll 瑞士卷
# 1.3.3 流形学习生成器 # make_swiss_roll from sklearn.datasets import make_swiss_roll from matplotlib import pyplot as plt from mpl_toolkits.mplot3d import Axes3D #导入3D绘图 Axes3D SEED = 666 X, color = make_swiss_roll (n_samples =10000, noise=0 , random_state=SEED) fig = plt.figure(figsize=(15, 8)) # 3D绘图 ax = fig.add_subplot(131, projection="3d") ax.scatter(X[:, 0], X[:, 1], X[:, 2], c=color, cmap=plt.cm.Spectral) ax.view_init(4, -80) #转换观察3D坐标系的视角 # 2D绘图 ax = fig.add_subplot(132) ax.scatter(X[:, 0], X[:, 1], X[:, 2], c=color, cmap=plt.cm.Spectral) # 绘制一下color的折线图 ax = fig.add_subplot(133) index = range(0,color.shape[0],100) ax.plot(color[index]) plt.show()
1.3.4 分解生成器
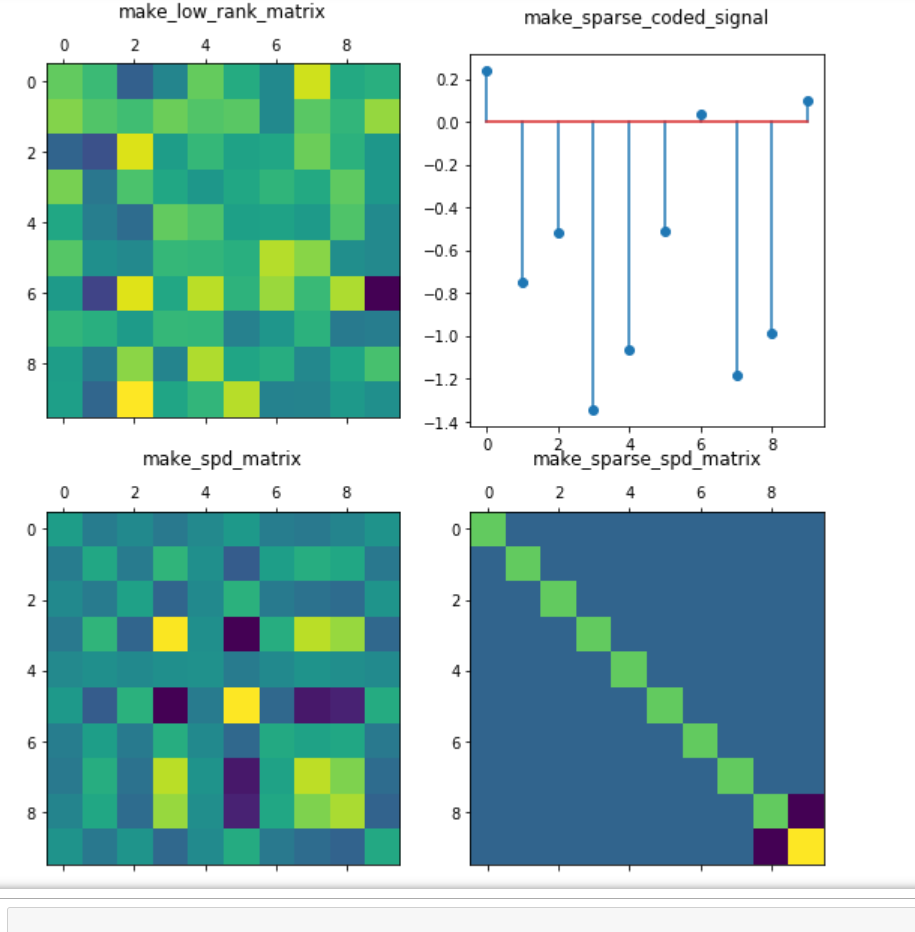
#### 1.3.4 分解生成器 from sklearn.datasets import make_low_rank_matrix,make_sparse_coded_signal,make_spd_matrix,make_sparse_spd_matrix from matplotlib import pyplot as plt import numpy as np SEED = 666 rng = np.random.RandomState(SEED) fig = plt.figure(figsize=(8, 8)) plt.subplots_adjust(bottom=0.05, top=1, left=0.05, right=0.95) ##### 1.3.4.1 make_low_rank_matrix ax = fig.add_subplot(221) matrix1 = make_low_rank_matrix(n_samples=10, n_features=10, effective_rank=1, tail_strength=0.5, random_state=rng) ax.matshow(matrix1) ax.set_title("make_low_rank_matrix",pad=20) ##### 1.3.4.2 make_sparse_coded_signal ax = fig.add_subplot(222) y, X, w = make_sparse_coded_signal(n_samples = 1, n_components=10, n_features=n_features, n_nonzero_coefs=10, random_state=rng) (idx,) = w.nonzero() ax.stem(idx, w[idx]) ax.set_title("make_sparse_coded_signal",pad=20) ##### 1.3.4.3 make_spd_matrix ax = fig.add_subplot(223) matrix2 = make_spd_matrix(10, random_state=rng) ax.matshow(matrix2) ax.set_title("make_spd_matrix",pad=20) ##### 1.3.4.4 make_sparse_spd_matrix ax = fig.add_subplot(224) matrix3 = make_sparse_spd_matrix(dim=10, alpha=0.95, norm_diag=False, smallest_coef=0.1, largest_coef=0.9, random_state=rng) ax.matshow(matrix3) ax.set_title("make_sparse_spd_matrix",pad=20) plt.show()
1.4 Loading other datasets 加载其他数据集

1.4.1 示例图像
只有两张样例图像,是彩色三通道的图像,这里有一个处理的例子:
# 1.4.1 示例图像 from sklearn.datasets import load_sample_images,load_sample_image from matplotlib import pyplot as plt import numpy as np # load_sample_images只有两张图片,彩色 images = load_sample_images() print("样例图像的格式(彩色三通道)",images['images'][0].shape) n = len(images['images']) tt = 0 f = plt.figure() for im in images['images']: f.add_subplot(1, n, tt + 1) tt = tt+1 plt.imshow(im) plt.show() # load_sample_image image_names = ['china.jpg','flower.jpg`'] plt.imshow(load_sample_image(image_names[0]))
1.4.2 svmlight / libsvm 格式的数据集
libsvm是一种机器学习中常见的数据保存格式,它有如下特征:
[label] [index1]:[value1] [index2]:[value2] …
[label] [index1]:[value1] [index2]:[value2] …
-
label 目标值,就是说class(属于哪一类),就是你要分类的种类,通常是一些整数。
-
index 是有顺序的索引,通常是连续的整数。就是指特征编号,必须按照升序排列
-
value 就是特征值,用来train的数据,通常是一堆实数组成。
即:
目标值 第一维特征编号:第一维特征值 第二维特征编号:第二维特征值 …
目标值 第一维特征编号:第一维特征值 第二维特征编号:第二维特征值 …
……
目标值 第一维特征编号:第一维特征值 第二维特征编号:第二维特征值 …
sklearn中提供了将数据加载成svmlight / libsvm 格式格式的方法,如下:
# 官方代码,未尝试
from sklearn.datasets import load_svmlight_file
X_train, y_train = load_svmlight_file("/path/to/train_dataset.txt")
# 可以一次加载两个(或更多)数据集:
X_train, y_train, X_test, y_test = load_svmlight_files(("/path/to/train_dataset.txt", "/path/to/test_dataset.txt"))
# 在这种情况下,X_train并X_test保证具有相同数量的功能。获得相同结果的另一种方法是固定特征数量
X_test, y_test = load_svmlight_file("/path/to/test_dataset.txt", n_features=X_train.shape[1])
同时,这里提供了一些公共的数据集
-
svmlight / libsvm 格式的公共数据集:
1.4.3 从 openml.org 存储库下载数据集
# 1.4.3 从 openml.org 存储库下载数据集 from sklearn.datasets import fetch_openml from matplotlib import pyplot as plt import numpy as np # 默认active版本的数据 iris_1 = fetch_openml(name="iris") print("name",iris_1.details['name']) print("version",iris_1.details['version']) # 当使用name来下载数据集的时候,可以指定version,默认的version是active print("id",iris_1.details['id']) # 不同版本的data_id不同 print("url",iris_1.details['url']) # 指定版本的数据 iris_3 = fetch_openml(name="iris",version =3) print("name",iris_3.details['name']) print("version",iris_3.details['version']) # 当使用name来下载数据集的时候,可以指定version,默认的version是active print("id",iris_3.details['id']) # 不同版本的data_id不同 print("url",iris_3.details['url']) # 通过data_id来获取数据 iris_969 = fetch_openml(data_id=969) print("name",iris_969.details['name']) print("version",iris_969.details['version']) # 当使用name来下载数据集的时候,可以指定version,默认的version是active print("id",iris_969.details['id']) # 不同版本的data_id不同 print("url",iris_969.details['url'])
1.4.4 从外部数据集加载
scikit-learn 适用于存储为 numpy 数组或 scipy 稀疏矩阵的任何数字数据。其他可转换为数值数组的类型,例如 pandas DataFrame 也是可以接受的。
以下是一些推荐的将标准柱状数据加载为 scikit-learn 可用格式的方法:
-
-
-
-
datasets.load_svmlight_file用于 svmlight 或 libSVM 稀疏格式的scikit-learn -
scikit-learn
datasets.load_files用于文本文件目录,其中每个目录的名称是每个类别的名称,每个目录中的每个文件对应于该类别的一个样本
对于图片、视频、音频等一些杂数据,您不妨参考:
以字符串形式存储的分类(或名义)特征(在 Pandas DataFrames 中很常见)需要使用
注意:如果您管理自己的数值数据,建议使用优化的文件格式,例如 HDF5,以减少数据加载时间。各种库,如 H5Py、PyTables 和 Pandas,都提供了一个 Python 接口来读取和写入该格式的数据。
1.x 参考
1.x2 附件:全部api
| 1.1 TOY DATASETS(小型数据集) | |
|---|---|
| 已弃用:load_boston在 1.0 中已弃用,并将在 1.2 中删除。 | |
| 加载并返回鸢尾植物数据集数据集(分类)。 | |
| 加载并返回糖尿病数据集(回归)。 | |
| 加载并返回图像数字数据集(分类)。 | |
| 加载并返回体育锻炼 Linnerud 数据集。 | |
| 加载并返回葡萄酒数据集(分类)。 | |
| 加载并返回威斯康星州乳腺癌数据集(分类)。 | |
| 1.2 Real world datasets(真实世界数据集) | |
| 从 AT&T 加载 Olivetti 人脸数据集(分类)。 | |
| 从 20 个新闻组数据集(分类)加载文件名和数据。 | |
| 加载和矢量化 20 个新闻组数据集(分类)。 | |
| 加载野外 (LFW) 人物数据集(分类)中的标记面孔。 | |
| 加载野外标记面 (LFW) 对数据集(分类)。 | |
| 加载covertype 数据集(分类)。 | |
| 加载 RCV1 多标签数据集(分类)。 | |
| 加载 kddcup99 数据集(分类)。 | |
| 加载加州住房数据集(回归)。 | |
| 来自 Phillips 等人的物种分布数据集加载器。 | |
| 1.3 Generated datasets 生成数据集 | |
| 1.3.1 分类聚类生成器(这些生成器产生一个特征矩阵和相应的离散目标。) | |
| 1.3.1.1 单标签 | |
| 生成用于聚类的各向同性高斯 blob。 | |
| 生成一个随机的 n 类分类问题。 | |
| 按分位数生成各向同性高斯和标签样本。 | |
| 为 Hastie 等人使用的二元分类生成数据。2009 年,示例 10.2。 | |
| 在 2d 中制作一个包含小圆的大圆。 | |
| 做两个交错的半圆。 | |
| 1.3.1.2 多标签 | |
| 生成随机多标签分类问题。 | |
| 1.3.1.3 双聚类 | |
| 生成具有恒定块对角线结构的数组用于双聚类。 | |
| 生成具有块棋盘结构的数组以进行双聚类。 | |
| 1.3.2 回归生成器 | |
| 生成随机回归问题。 | |
| 使用稀疏不相关设计生成随机回归问题。 | |
| 生成“Friedman #1”回归问题。 | |
| 生成“Friedman #2”回归问题。 | |
| 生成“Friedman #3”回归问题。 | |
| 1.3.3 流形学习生成器 | |
| 生成 S 曲线数据集。 | |
| 生成瑞士卷数据集。 | |
| 1.3.4 分解生成器 | |
| 生成具有钟形奇异值的大部分低秩矩阵。 | |
| 将信号生成为字典元素的稀疏组合。 | |
| 生成稀疏对称定正矩阵。 | |
| 生成随机对称的正定矩阵。 | |
| Loading other datasets 加载其他数据集 | |
| 1.4.1 示例图像 | |
| 加载示例图像以进行图像处理。 | |
| 加载单个样本图像的 numpy 数组 | |
| 1.4.2 svmlight / libsvm 格式的数据集 | |
| 以 svmlight / libsvm 文件格式转储数据集。 | |
| 将 svmlight / libsvm 格式的数据集加载到稀疏 CSR 矩阵中 | |
| 从多个文件以 SVMlight 格式加载数据集 | |
| 1.4.3 从 openml.org 存储库下载数据集 | |
| 按名称或数据集 ID 从 openml 获取数据集。 | |
| 1.4.4 从外部数据集加载 | |
| 一些其他的方法 | |
| 删除数据主缓存的所有内容。 | |
| 返回 scikit-learn 数据目录的路径。 | |
| 加载以类别作为子文件夹名称的文本文件。 |
1.x3 无关拓展:绘图Graph
参考:
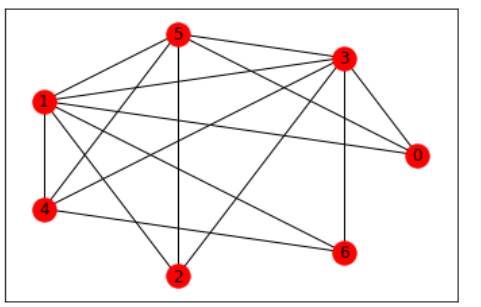
import networkx as nx import matplotlib.pyplot as plt G=nx.Graph() point=[0,1,2,3,4,5,6] G.add_nodes_from(point) edglist=[] N = [[0, 3, 5, 1],[1, 5, 4, 3],[2, 1, 3, 5],[3, 5, 1, 4],[4, 5, 1, 3],[5, 3, 4, 1],[6, 3, 1, 4]] for i in range(7): for j in range(1,4): edglist.append((N[i][0],N[i][j])) G=nx.Graph(edglist) position = nx.circular_layout(G) nx.draw_networkx_nodes(G,position, nodelist=point, node_color="r") nx.draw_networkx_edges(G,position) nx.draw_networkx_labels(G,position) plt.show()


【推荐】国内首个AI IDE,深度理解中文开发场景,立即下载体验Trae
【推荐】编程新体验,更懂你的AI,立即体验豆包MarsCode编程助手
【推荐】抖音旗下AI助手豆包,你的智能百科全书,全免费不限次数
【推荐】轻量又高性能的 SSH 工具 IShell:AI 加持,快人一步
· AI与.NET技术实操系列:基于图像分类模型对图像进行分类
· go语言实现终端里的倒计时
· 如何编写易于单元测试的代码
· 10年+ .NET Coder 心语,封装的思维:从隐藏、稳定开始理解其本质意义
· .NET Core 中如何实现缓存的预热?
· 25岁的心里话
· 基于 Docker 搭建 FRP 内网穿透开源项目(很简单哒)
· 闲置电脑爆改个人服务器(超详细) #公网映射 #Vmware虚拟网络编辑器
· 一起来玩mcp_server_sqlite,让AI帮你做增删改查!!
· 零经验选手,Compose 一天开发一款小游戏!