ECharts连接数据库的具体实现
相关描述
我们由之前的实例可以得知,要是不连接数据库的话,只是需要套用一下ECharts的相关模板即可,这部分内容我在前几篇中已经叙述过了;
现在,我们需要实现的是,将数据库里面的数据导入到web网页中,但是不是单纯地数据显示,而是要利用ECharts实现数据库数据的可视化。
经过查阅相关资料可知,需要用到ajax的相关技术知识。
具体实现
在这里需要用到这两个坐标:
<!-- https://mvnrepository.com/artifact/io.leopard.boot/leopard-boot-requestmapping -->
        <dependency>
            <groupId>io.leopard.boot</groupId>
            <artifactId>leopard-boot-requestmapping</artifactId>
            <version>0.9.20</version>
        </dependency>
<!-- https://mvnrepository.com/artifact/io.leopard.boot/leopard-boot-responsebody -->
        <dependency>
            <groupId>io.leopard.boot</groupId>
            <artifactId>leopard-boot-responsebody</artifactId>
            <version>0.9.20</version>
        </dependency>
我发现,连接数据库的操作还是跟以前一样,就连servlet的代码都是差不多一样的,主要区别就在于前端代码有了echarts页面模块的加入,其余的也是之前都涉及到过的;
//DBUtil.java
package org.example.Connect;

import javax.servlet.jsp.jstl.sql.Result;
import java.sql.*;

public class DBUtil {
    public static String db_url="jdbc:mysql://localhost:3306/aa?useSSL=false";
    public static String db_user="root";
    public static String db_password="20214063";

    public static Connection getConn() {
        Connection conn=null;

        try {
            Class.forName("com.mysql.cj.jdbc.Driver");
            conn= DriverManager.getConnection(db_url,db_user,db_password);

        } catch (ClassNotFoundException | SQLException e) {
            e.printStackTrace();
        }

        return conn;

    }

    public static void close(Statement stmt, Connection conn){
        if(stmt!=null){
            try {
                stmt.close();
            } catch (SQLException e) {
                e.printStackTrace();
            }
        }

        if(conn!=null){
            try {
                conn.close();
            } catch (SQLException e) {
                e.printStackTrace();
            }
        }
    }

    public static void close(ResultSet rs, Statement stmt, Connection conn){
        if(rs!=null){
            try {
                rs.close();
            } catch (SQLException e) {
                e.printStackTrace();
            }
        }

        if(stmt!=null){
            try {
                stmt.close();
            } catch (SQLException e) {
                e.printStackTrace();
            }
        }

        if(conn!=null){
            try {
                conn.close();
            } catch (SQLException e) {
                e.printStackTrace();
            }
        }
    }

    public void close(PreparedStatement psmt,Connection conn){
        if(psmt!=null){
            try {
                psmt.close();
            } catch (SQLException e) {
                e.printStackTrace();
            }
        }

        if(conn!=null){
            try {
                conn.close();
            } catch (SQLException e) {
                e.printStackTrace();
            }
        }
    }

    public void close(ResultSet rs,PreparedStatement psmt,Connection conn){
        if(rs!=null){
            try {
                rs.close();
            } catch (SQLException e) {
                e.printStackTrace();
            }
        }

        if(psmt!=null){
            try {
                psmt.close();
            } catch (SQLException e) {
                e.printStackTrace();
            }
        }

        if(conn!=null){
            try {
                conn.close();
            } catch (SQLException e) {
                e.printStackTrace();
            }
        }
    }


}
//chartDao.java
package org.example.Dao;

import com.alibaba.fastjson.JSONArray;
import org.example.Connect.DBUtil;

import java.sql.Connection;
import java.sql.ResultSet;
import java.sql.SQLException;
import java.sql.Statement;
import java.util.ArrayList;
import java.util.Date;
import java.util.List;

import org.example.Bean.ec;

public class chartDao {
    public List<ec> search(){
        String sql="select * from ec";

        List<ec> list=new ArrayList<>();
        Connection conn=DBUtil.getConn();
        Statement stmt=null;
        ResultSet rs=null;

        try {
            stmt=conn.createStatement();
            rs=stmt.executeQuery(sql);

            ec e=null;
            while(rs.next()){
                String name=rs.getString("name");
                int count=Integer.parseInt(rs.getString("count"));

                System.out.println(name);
                System.out.println(count);//成功导出数据
                e=new ec(name,count);
                list.add(e);
                System.out.println(list);//成功进入到list集合里面
            }
        } catch (SQLException e) {
            e.printStackTrace();
        }finally{
            DBUtil.close(rs,stmt,conn);
        }

        return list;
    }
}
//chartServlet.java
package org.example.Servlet;

import org.example.Dao.chartDao;

import javax.servlet.ServletException;
import javax.servlet.annotation.WebServlet;
import javax.servlet.http.HttpServlet;
import javax.servlet.http.HttpServletRequest;
import javax.servlet.http.HttpServletResponse;
import java.io.IOException;
import java.io.UnsupportedEncodingException;
import java.util.List;

import org.example.Bean.ec;

@WebServlet("/chartServlet")
public class chartServlet extends HttpServlet {
    private static final long serialVersionUID = 1L;

    chartDao cd=new chartDao();

    protected void service(HttpServletRequest req,HttpServletResponse resp) throws IOException, ServletException {
        req.setCharacterEncoding("utf-8");
        resp.setContentType("text/html;charset=utf-8");

        String method=req.getParameter("method");
        if("search".equals(method)){
            search(req,resp);
        }


    }

    private void search(HttpServletRequest req,HttpServletResponse resp) throws IOException, ServletException {
        req.setCharacterEncoding("utf-8");
        resp.setContentType("text/html;charset=utf-8");

        List<ec> list=cd.search();
        System.out.println(list);
        req.setAttribute("list",list);//成功,问题出在chart1.jsp页面里面
        req.getRequestDispatcher("chart1.jsp").forward(req,resp);
    }
}
//chart1.jsp
<%@ taglib prefix="c" uri="http://java.sun.com/jsp/jstl/core" %>
<%--
  Created by IntelliJ IDEA.
  User: 12140
  Date: 2023/2/21
  Time: 23:31
  To change this template use File | Settings | File Templates.
--%>
<%@ page contentType="text/html;charset=UTF-8" language="java" %>
<html>
<head>

  <script src="lib/echarts.min.js"></script>
  <script src="https://code.jquery.com/jquery-3.3.1.min.js"></script>
    <title>浏览界面</title>
</head>
<body>
<%--<%--%>
<%--  Object message=request.getAttribute("message");--%>
<%--  if(message!=null&&!"".equals(message)){--%>
<%--    %>--%>
<%--<script type="text/javascript">--%>
<%--  alert(<%=request.getAttribute("message")%>);--%>
<%--</script>--%>
<%--<%}%>--%>

<div align="center">
  <table border="1">
    <tr>
      <th>地区名称</th>
      <th>地区人数</th>
    </tr>

    <c:forEach items="${list}" var="l">
      <tr>
        <td>${l.name}</td>
        <td>${l.count}</td>
      </tr>
    </c:forEach>
  </table>
</div>

<%--以下内容--图--不显示--%>
<div id="main" style="width:400px;height:400px;"></div>

<script type="text/javascript">
  var myCharts=echarts.init(document.getElementById("main"));

  var array=new Array();
  var index=0;
  <c:forEach items="${list}" var="l">
  array[index++]=${l.count};
  </c:forEach>

  //指定表
  var option={
    title:{
      text:"地区人数图"
    },
    tooltip:{
      show:true
    },
    legend:{
      data:['各地区人数']
    },
    xAxis:[
            {
      type:'category',
      data:[
              <c:forEach items="${list}" var="l">
              ["${l.name}"],
        </c:forEach>
      ]
    }
    ],
    yAxis:[
      {
        type:'value'
      }
    ],
    series:[
      {
        name:'count',
        type:'bar',
        data:array
      }
    ]
  };

  myCharts.setOption(option);
</script>
</body>
</html>
//chart2.jsp
<%@ page contentType="text/html;charset=UTF-8" language="java" %>
<html>
<head>
    <title>查询界面</title>
</head>
<body>
<form action="chartServlet?method=search" method="post">
    <center>
        <table border="1">
            <tr>
                <td>请输入你想要查询的地区:</td>
                <td><input type="text" name="whe"></td>
            </tr>

            <tr>
                <td colspan="2" align="center"><input type="submit" value="查询"></td>
            </tr>
        </table>
    </center>
</form>
</body>
</html>
其中,chart2的jsp页面就是一个凑一下数的,本来是为了让这个功能更加完整一些的,但是加上它并没有什么用,但是也不想删除了,其逻辑思路也可以运用到增删改查里面去,也就放在这里起到提供一种逻辑思路的作用啦!
注意啦!在写ECharts的图表时,一定不要多啥少啥,不然真的出不来
就像这里:
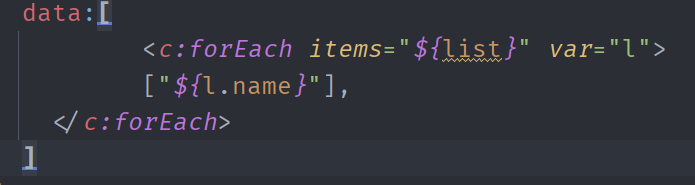
那个逗号,别少啦!!!!!!!!!!!!
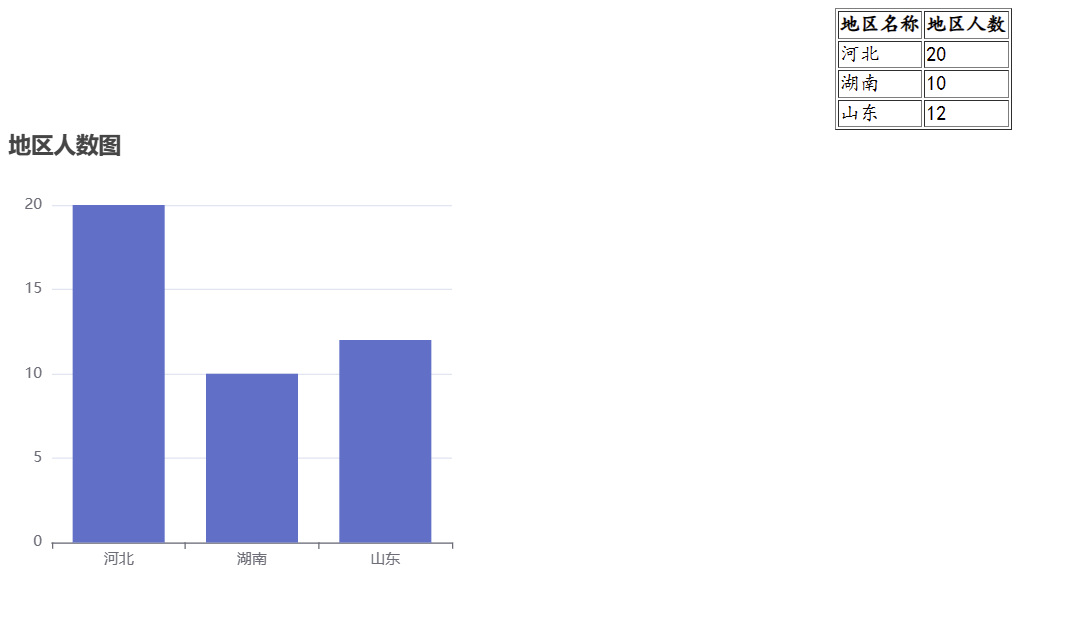
结果呈现:

 浙公网安备 33010602011771号