13
boston.keys()
print(boston.DESCR)
boston.data.shape
boston.feature_names
boston.target
import pandas as pd
df = pd.DataFrame(boston.data)
df
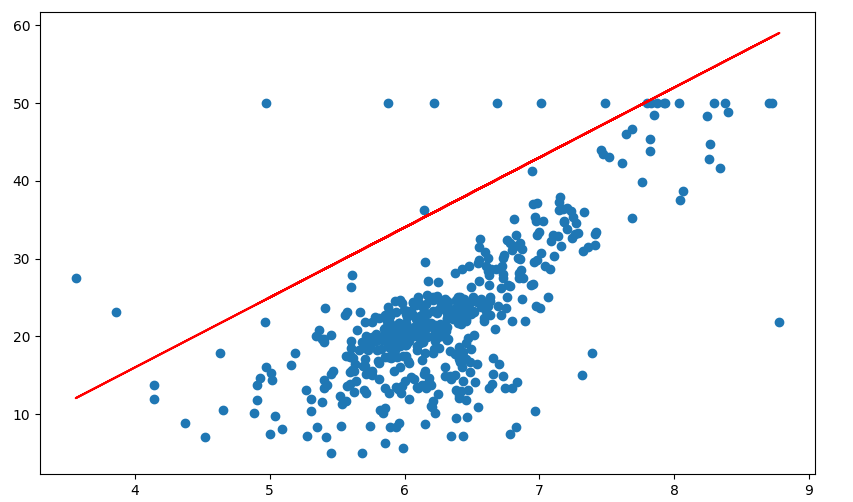
#1.导入boston房价数据集
from sklearn.datasets import load_boston
boston = load_boston()
boston.keys()

print(boston.DESCR)
boston.data.shape
boston.feature_names

import pandas as pd
pd.DataFrame(boston.data)
import matplotlib.pyplot as plt
x = boston.data[:,5]
y = boston.target
plt.figure(figsize=(10,6))
plt.scatter(x,y)
plt.plot(x,9*x-20,'r')
plt.show()

from sklearn.linear_model import LinearRegression
lineR=LinearRegression()
lineR.fit(x.reshape(-1,1),y)
w=lineR.coef_
b = lineR.intercept_

from sklearn.linear_model import LinearRegression
lineR = LinearRegression()
lineR.fit(boston.data,y)
w = lineR.coef_
b = lineR.intercept_

import matplotlib.pyplot as plt
x=boston.data[:,12].reshape(-1,1)
y=boston.target
plt.figure(figsize=(10,6)) #指定显示图大小
plt.scatter(x,y)

from sklearn.linear_model import LinearRegression
lineR=LinearRegression()
lineR.fit(x,y)
y_pred=lineR.predict(x)
plt.plot(x,y_pred,'green')
print(lineR.coef_,lineR.intercept_)
plt.show()

from sklearn.preprocessing import PolynomialFeatures
poly = PolynomialFeatures(degree=2)
x_poly = poly.fit_transform(x)

lrp = LinearRegression()
lrp.fit(x_poly,y)
y_poly_pred = lrp.predict(x_poly)

plt.scatter(x,y)
plt.plot(x,y_poly_pred,'r')
plt.show()

from sklearn.preprocessing import PolynomialFeatures
poly = PolynomialFeatures(degree=2)
x_poly = poly.fit_transform(x)

lrp = LinearRegression()
lrp.fit(x_poly,y)
plt.scatter(x,y)
plt.scatter(x,y_pred)
plt.scatter(x,y_poly_pred)   #多项回归
plt.show()