Circos作图进阶系列(一)
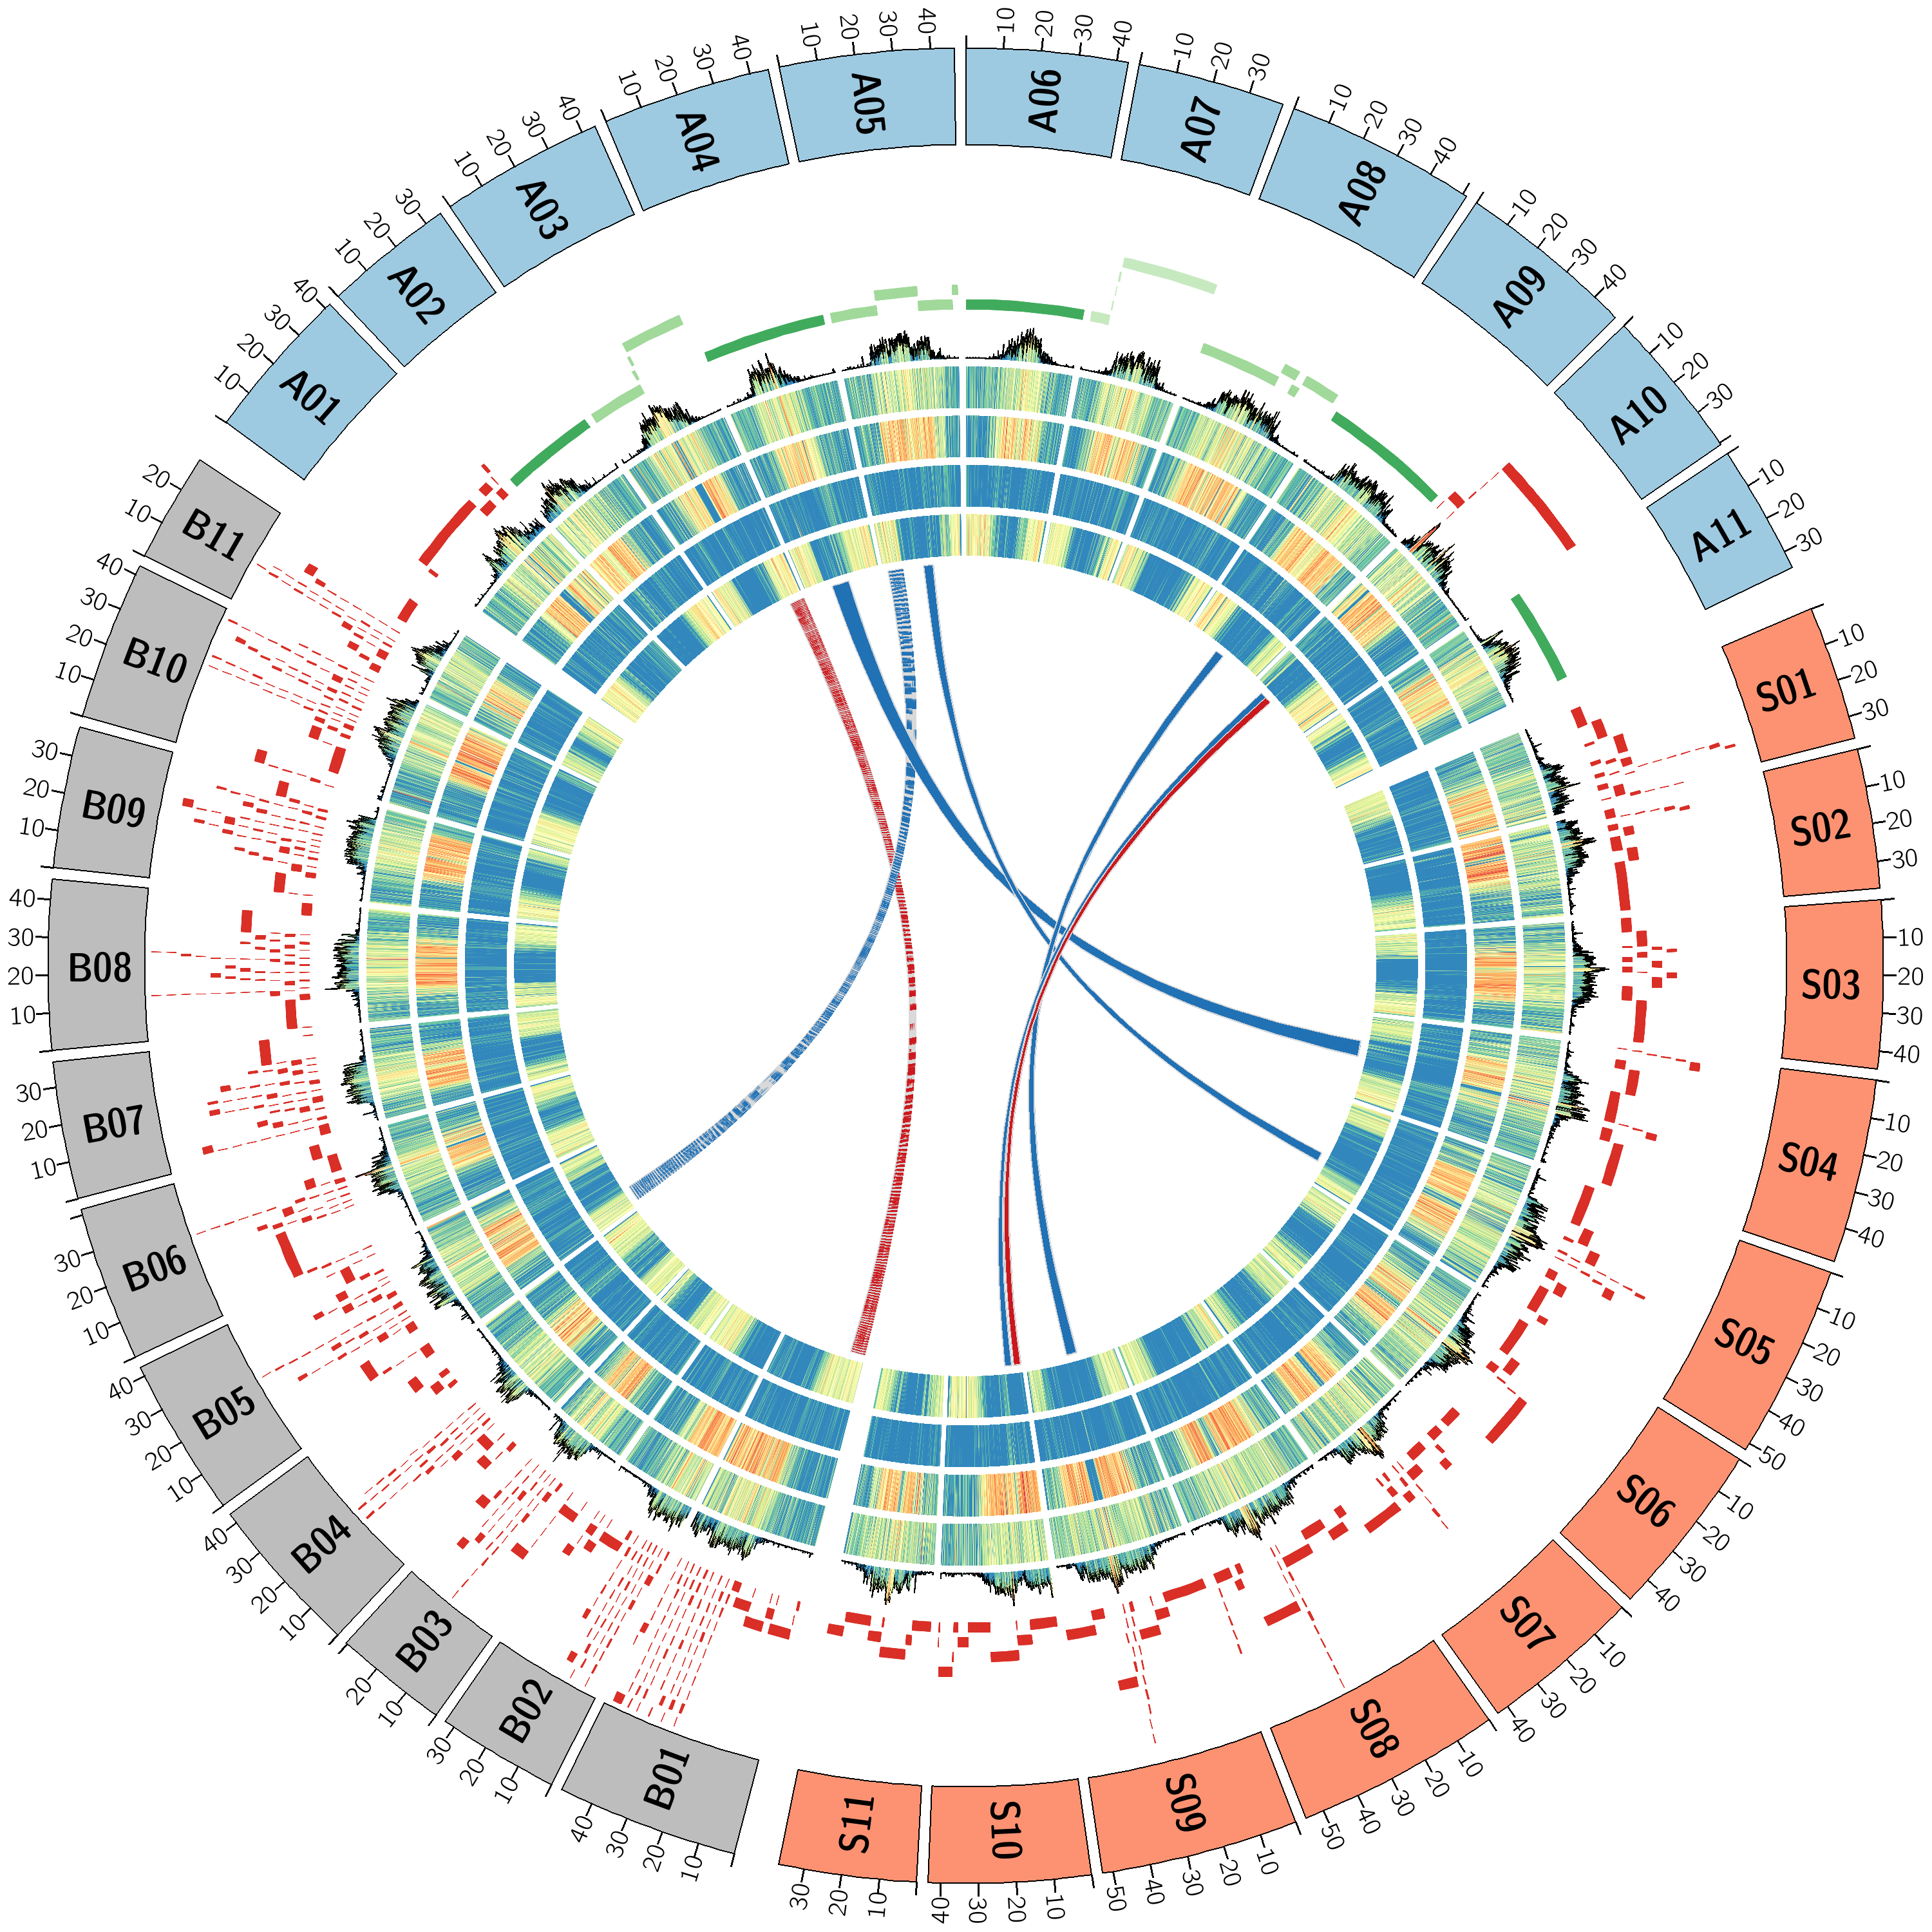
今天跟着NCB的这篇文章学习circos作图各个模块的配置方法。关于circos.conf部分稍做了修改,使各个模块独立,结构更加清晰。作图代码及数据均来自于作者Github。其中配置contig组成展示的部分值得学习。
### 作图代码:
https://github.com/institut-de-genomique/Pahang-associated-data/tree/main/Figure1
### 数据来源:
Belser C, Baurens FC, Noel B, Martin G, Cruaud C, Istace B, Yahiaoui N, Labadie K, Hřibová E, Doležel J, Lemainque A, Wincker P, D'Hont A, Aury JM. Telomere-to-telomere gapless chromosomes of banana using nanopore sequencing. Commun Biol. 2021 Sep 7;4(1):1047. doi: 10.1038/s42003-021-02559-3. PMID: 34493830; PMCID: PMC8423783.
https://github.com/institut-de-genomique/Pahang-associated-data/tree/main/Figure1
一、数据准备
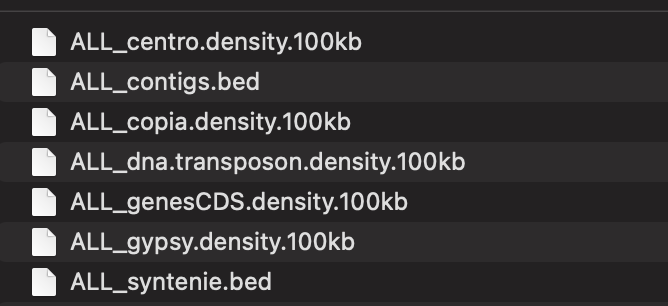
作者提供的包里已经有了如下数据,作为circos的数据输入。以下输入数据来自于基因组重复注释gff文件、基因注释gff文件、共线性搜索等分析。

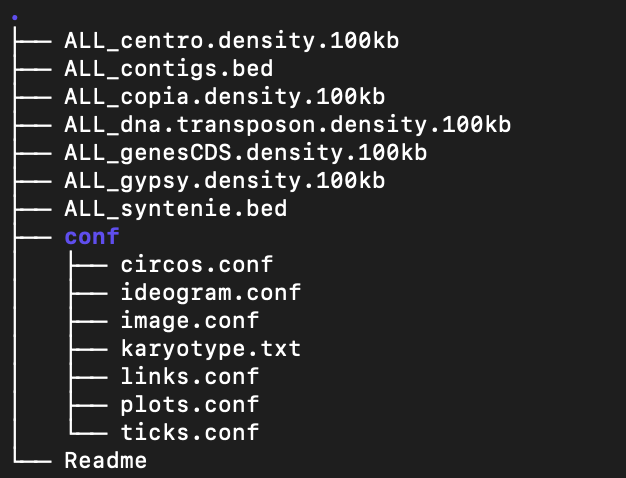
查看目录结构。

二、Circos配置
<Circos.conf> 主文件配置,接下来依次配置各个模块。最末两行为引用软件etc中已有模块,无需改动。
karyotype   = karyotype.txt

chromosomes_units = 1000000

chromosomes_display_default = yes

<<include ideogram.conf>>

<<include ticks.conf>>

<<include image.conf>>

<<include plots.conf>>

<<include links.conf>>

<<include etc/colors_fonts_patterns.conf>>

<<include etc/housekeeping.conf>>
<ideogram.conf> 这个模块主要控制染色体排版方式,包括染色体间隔、填充颜色、染色体标签等。
<ideogram>

<spacing>

  default = 3u
  break   = 1u

  <pairwise A11 S01>
    spacing = 12u
  </pairwise>

  <pairwise S11 B01>
    spacing = 12u
  </pairwise>

  <pairwise B11 A01>
    spacing = 12u
  </pairwise>


</spacing>

# thickness (px) of chromosome ideogram
thickness        = 150p
stroke_thickness = 2
# ideogram border color
stroke_color     = black
fill             = yes
# the default chromosome color is set here and any value
# defined in the karyotype file overrides it
fill_color       = blue

# fractional radius position of chromosome ideogram within image
radius         = 0.95r
show_label     = yes
label_with_tag = yes
label_font     = condensedbold
label_radius   = dims(ideogram,radius) - 0.1r
label_size     = 48


</ideogram>
<ticks.conf> 主要控制染色体上刻度显示。
show_ticks          = yes
show_tick_labels    = yes


<ticks>
skip_first_label     = no
skip_last_label      = no
radius               = dims(ideogram,radius_outer)
min_label_distance_to_edge = 10p
label_offset     = 2p
label_size = 8p
multiplier = 1e-6
color = black

<tick>
spacing        = 10u
size           = 20p
thickness      = 3p
color          = black
show_label     = yes
label_size     = 30p
label_offset   = 0p
format         = %d
</tick>
</ticks>
<image.conf> 该模块主要控制图像输出、设置图像半径、颜色背景、排版旋转角度等
<image>
svg = yes
dir            = ./
file           = circos-Musa_genomes_comparison.png
# radius of inscribed circle in image
radius         = 1500p
background     = white
# by default angle=0 is at 3 o'clock position
angle_offset   = -90
</image>
<plots.conf> 该模块属于绘图模块,可以绘制histogram、dotplot、lineplot、heatmap等,均使用相同的数据输入格式。对应从外至内依次绘制展示6圈不同的数据。第二圈主要显示contig、其他的主要显示重复序列密度或者基因CDS密度。
<plots>
   <plot>
    type = tile
    file = ALL_contigs.bed
    r1   = 0.99r
    r0   = 0.80r
    layers = 12
    thickness = 15
    padding = 8
    color = vdblue
    stroke_color = vdblue
    stroke_thickness = 1
    show = yes
    <rules>

	<rule>
	condition    = var(id) ==1
	stroke_color = dgreen
	color = dgreen
	flow         = continue
	</rule>

	<rule>
	condition    = var(id) ==2
	stroke_color = green
	color = green
	</rule>

	<rule>
	condition    = var(id) ==3
	stroke_color = green
	color = green
	</rule>

	<rule>
	condition    = var(id) ==4
	stroke_color = lgreen
	color = lgreen
	</rule>

	<rule>
	condition    = var(id) == 5
	stroke_color = vlgreen
	color = vlgreen
	</rule>

	<rule>
	condition    = var(id) > 5
	stroke_color = acen
	color = acen
	</rule>
   </rules>

  </plot>
  <plot>
    type = histogram
    stroke_type = outline
    thickness   = 2
    color       = black
    extend_bin  = yes
    file = ALL_centro.density.100kb
    show  = yes
    r1    = 0.79r
    r0    = 0.74r
    <backgrounds>
      <background>
        color = white #vvlgrey
      </background>
    </backgrounds>
    <rules>
      <rule>
        condition = 1
	fill_color = eval(sprintf("spectral-9-div-%d",remap_int(var(value),30,100,9,1)))
      </rule>
    </rules>
  </plot>

  <plot>
    type  = heatmap
    color = spectral-9-div-rev
    file  = ALL_gypsy.density.100kb
    scale_log_base = 0.5
    show  = yes
    r1    = 0.73r
    r0    = 0.68r
  </plot>
  <plot>
    type  = heatmap
    color = spectral-9-div-rev
    file  = ALL_copia.density.100kb
    scale_log_base = 0.5
    show  = yes
    r1    = 0.67r
    r0    = 0.62r
  </plot>
  <plot>
    type  = heatmap
    color = spectral-9-div-rev
    file  = ALL_dna.transposon.density.100kb
    scale_log_base = 1
    show  = yes
    r1    = 0.61r
    r0    = 0.56r
  </plot>
  <plot>
    type  = heatmap
    color = spectral-9-div-rev
    file  = ALL_genesCDS.density.100kb
    scale_log_base = 1
    show  = yes
    r1    = 0.55r
    r0    = 0.50r
  </plot>


</plots>
<links.conf> 该模块主要展示染色体间的共线性。通过对共线性块bed文件增加id列,然后通过rule增加condition匹配,来实现对不同的共线性块标记不同的颜色。
<links>
	radius = 0.49r
	crest  = 1
	ribbon           = yes
	flat             = yes
	bezier_radius        = 0r
	bezier_radius_purity = 0.5

	<link>
	 file          = ALL_syntenie.bed
	 stroke_color     = vlgrey
	 stroke_thickness = 2
	 color            = vlgrey
	 <rules>

		<rule>
		condition    = var(id) ==1
		color        = vdred
		flow         = continue
	 	</rule>

		<rule>
		condition    = var(id) ==2
		color        = vdblue
		flow         = continue
	 	</rule>


	</rules>

	</link>


</links>
三、绘图
进入conf目录,使用circos一键绘图
circos -conf circos.conf运行成功后,当前目录下便会生成circos-Musa_genomes_comparison.svg以及circos-Musa_genomes_comparison.png


