Signalr Vue Echarts绘制实时CPU使用率
后端基于Asp.net webapi,前端Vue,前后端分离,该demo仅做演示,实现的细节可以自己优化
Echarts:4.2.1 可参考 官网
Jquery:3.4.1
Signalr:2.4.1 可参考 官网
Vue:2.5.2
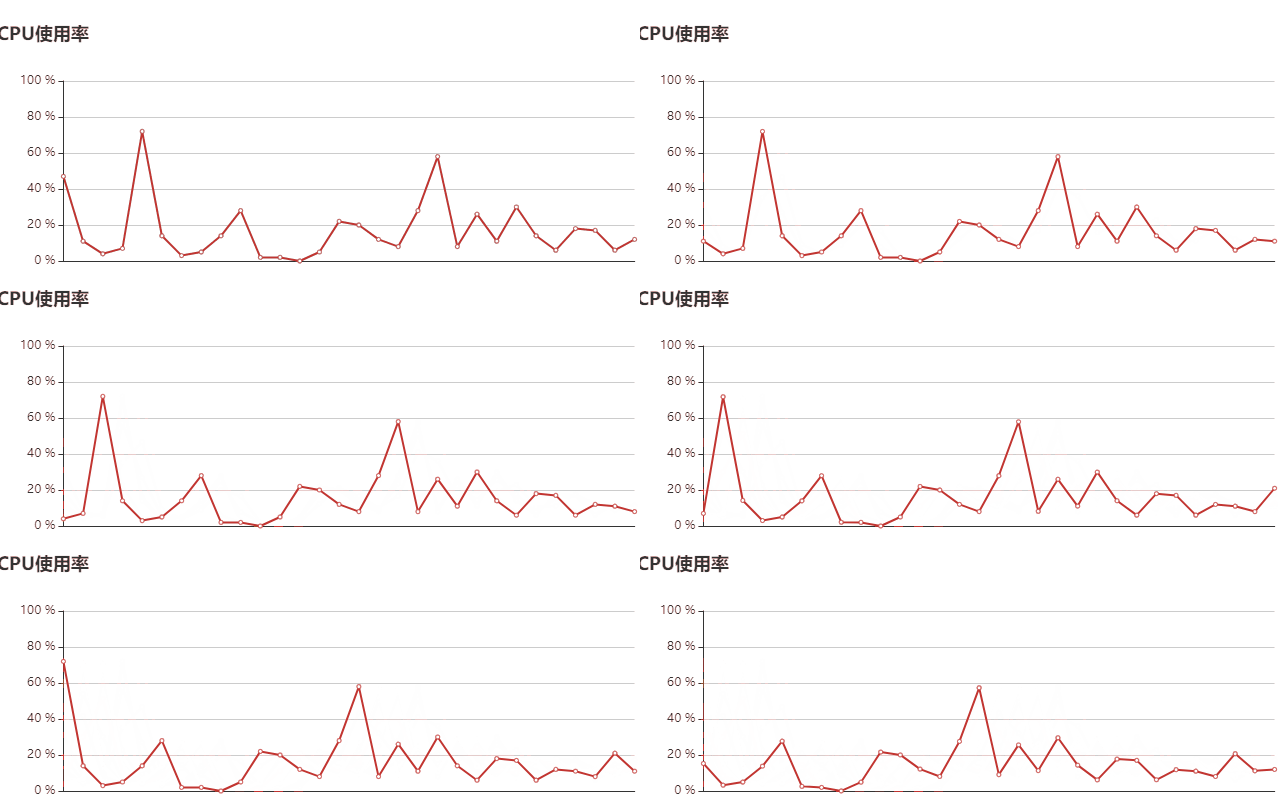
效果:

1.创建Web API项目
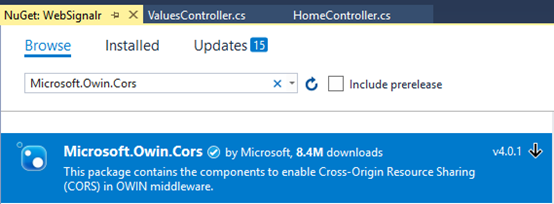
使用nuget导入signalr和Microsoft.Owin.Cors


2.在Hubs下创建Signalr hub class
    public class CPUHelper
    {
        public static string GetPercentProcessor()
        {
            ManagementObjectSearcher searcher = new ManagementObjectSearcher("select * from Win32_PerfFormattedData_PerfOS_Processor");
            var cpuTimes = searcher.Get()
                .Cast<ManagementObject>()
                .Select(mo => new
                {
                    Name = mo["Name"],
                    Usage = mo["PercentProcessorTime"]
                }
                )
                .ToList();

            var query = cpuTimes.Where(x => x.Name.ToString() == "_Total").Select(x => x.Usage);
            return query.SingleOrDefault().ToString();
        }
    }

    public class CpuHub : Hub
    {
        public void Notify()
        {
            var res = CPUHelper.GetPercentProcessor();
            Clients.All.getPercentProcessor(res);
        }
    }
3.在App_Start下创建Startup类
[assembly: OwinStartup(typeof(WebSignalr.App_Start.Startup))]
namespace WebSignalr.App_Start
{
    public class Startup
    {
        public void Configuration(IAppBuilder app)
        {
            // 允许跨域
            app.UseCors(CorsOptions.AllowAll);
            app.MapSignalR();
        }
    }
}
4.运行站点访问http://localhost:57577/signalr/hubs 可以看到自动生成的客户端代理js代码(端口号可能不一致)
5.创建vue项目,打开vscode,打开新建的项目文件夹,打开终端
运行 npm install -g vue-cli 初始化vue
运行 vue init webpack projectName 创建vue项目,完成后
运行 cd projectName 转到项目目录,执行 npm run dev 成功后访问 localhost:8080 预览
运行 npm install echarts -S 引入echats包
运行 npm i signalr jquery -S 引入Jquery 和 signalr
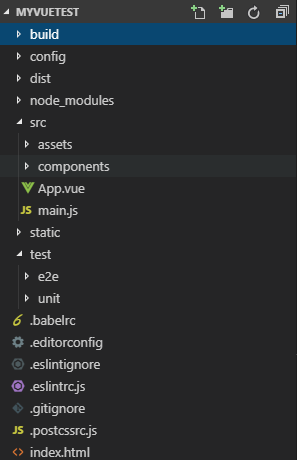
完成后结果如下

6.修改main.js如下
import Vue from 'vue'
import App from './App'
import echarts from 'echarts'
/* eslint-disable */
import $ from 'jquery'
import 'signalr'

Vue.config.productionTip = false
Vue.prototype.$echarts = echarts

/* eslint-disable no-new */
new Vue({
  el: '#app',
  components: { App },
  template: '<App/>'
})
7.在components文件夹下创建charts文件夹,并创建文件DynamicCharts.vue
<template>
  <div :id='id' :style='style'></div>
</template>
<script>
export default {
  name: 'Chart',
  data () {
    return {
      chart: ''
    };
  },
  props: {
    id: {
      type: String
    },
    width: {
      type: String,
      default: '100%'
    },
    height: {
      type: String,
      default: '300px'
    },
    option: {
      type: Object,
      default () {
        return {
          title: {
            text: 'test'
          },
          legend: {
            data: 'tag'
          },
          xAxis: {
            data: []
          },
          yAxis: [
            {
              type: 'value'
            }
          ],
          series: [
            {
              name: 'tag',
              type: 'line',
              data: []
            }
          ]
        };
      }
    }
  },
  computed: {
    style () {
      return {
        height: this.height,
        width: this.width
      };
    }
  },
  mounted () {
    this.init();
  },
  methods: {
    init () {
      window.addEventListener('resize', this.chart.resize);
      this.chart = this.$echarts.init(document.getElementById(this.id));
      this.chart.setOption(this.option);
    }
  },
  watch: {
    option: {
      handler: function (val, oldval) {
        if (this.chart) {
          if (val) {
            this.chart.setOption(val);
          } else {
            this.chart.setOption(oldval);
          }
        } else {
          this.init();
        }
      },
      deep: true
    }
  }
};
</script>
8.修改App.vue,引入Chart组件

<template>
  <div id='app'>
    <Chart id='test' :option='option'></Chart>
  </div>
</template>
<script>
import Chart from './components/charts/DynamicCharts';
export default {
  name: 'App',
  components: {
    Chart
  },
  data () {
    return {
      option: {
        title: {
          text: 'CPU使用率'
        },
        xAxis: [
          {
            type: 'category',
            boundaryGap: false,
            data: []
          }
        ],
        yAxis: [
          {
            type: 'value',
            max: 100,
            axisLabel: {
              formatter: '{value} %'
            }
          }
        ],
        series: [
          {
            type: 'line',
            data: []
          }
        ]
      }
    };
  },
  mounted () {
    console.log('init');
    this.init();
    this.connect();
  },
  methods: {
    init () {
      var signalR = $.signalR;
      var $this = this;
      $.hubConnection.prototype.createHubProxies = function () {
        var proxies = {};
        this.starting(function () {
          $this.registerHubProxies(proxies, true);
          this._registerSubscribedHubs();
        }).disconnected(function () {
          $this.registerHubProxies(proxies, false);
        });
        proxies['cpuHub'] = this.createHubProxy('cpuHub');
        proxies['cpuHub'].client = {};
        proxies['cpuHub'].server = {
          notify: function () {
            return proxies['cpuHub'].invoke.apply(
              proxies['cpuHub'],
              $.merge(['Notify'], $.makeArray(arguments))
            );
          }
        };
        return proxies;
      };
      signalR.hub = $.hubConnection('http://localhost: 57577/signalr', {
        useDefaultPath: false
      });
      $.extend(signalR, signalR.hub.createHubProxies());
    },
    initdata () {
      for (let i = 0; i < 60; i++) {
        this.option.series[0].data.push(this.rnd(30, 80));
      }
    },
    connect () {
      var cpu = $.connection.cpuHub;
      var that = this.option.series[0].data;
      cpu.client.getCPUPercent = (pers) => {
        if (that.length >= 30) {
          that.shift();
        }
        that.push(pers);
      };
      $.connection.hub.start().done(function () {
        window.setInterval(function () {
          cpu.server.send(20);
        }, 2000);
      });
    },
    rnd (n, m) {
      var random = Math.floor(Math.random() * (m - n + 1) + n);
      return random;
    },
    makeProxyCallback (hub, callback) {
      return function () {
        callback.apply(hub, $.makeArray(arguments));
      };
    },
    registerHubProxies (instance, shouldSubscribe) {
      var key, hub, memberKey, memberValue, subscriptionMethod;
      for (key in instance) {
        if (instance.hasOwnProperty(key)) {
          hub = instance[key];
          if (!hub.hubName) {
            // Not a client hub
            continue;
          }
          if (shouldSubscribe) {
            // We want to subscribe to the hub events
            subscriptionMethod = hub.on;
          } else {
            // We want to unsubscribe from the hub events
            subscriptionMethod = hub.off;
          }
          // Loop through all members on the hub and find client hub functions to subscribe/unsubscribe
          for (memberKey in hub.client) {
            if (hub.client.hasOwnProperty(memberKey)) {
              memberValue = hub.client[memberKey];
              if (!$.isFunction(memberValue)) {
                // Not a client hub function
                continue;
              }
              // Use the actual user-provided callback as the 'identity' value for the registration.
              subscriptionMethod.call(
                hub,
                memberKey,
                this.makeProxyCallback(hub, memberValue),
                memberValue
              );
            }
          }
        }
      }
    }
  }
};
</script>

<style>
#app {
  font-family: 'Avenir', Helvetica, Arial, sans-serif;
  -webkit-font-smoothing: antialiased;
  -moz-osx-font-smoothing: grayscale;
  text-align: center;
  color: #2c3e50;
  margin-top: 60px;
}
</style>
注:其中关于访问服务端signalr代码完全拷贝于第4步生成的js代码,仅仅需要修改hubConnection地址
最后在终端运行 npm run dev
本文地址:https://www.cnblogs.com/liuxiaobo93/p/11244762.html
如果遇到任何问题,欢迎留言讨论


