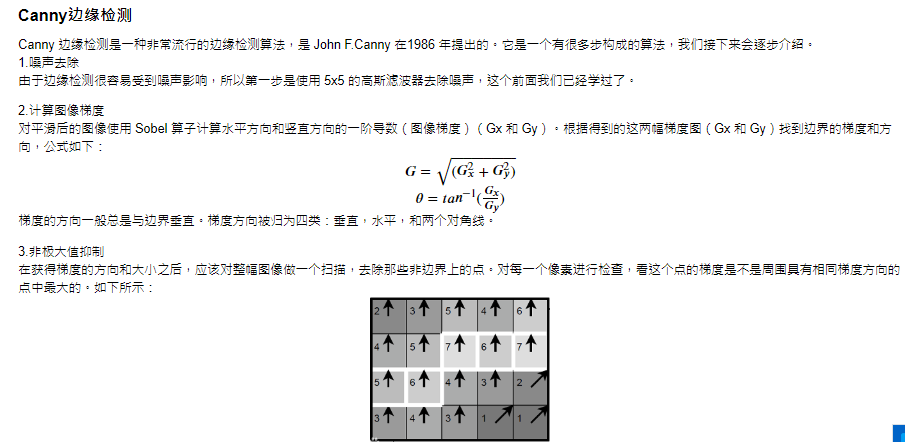
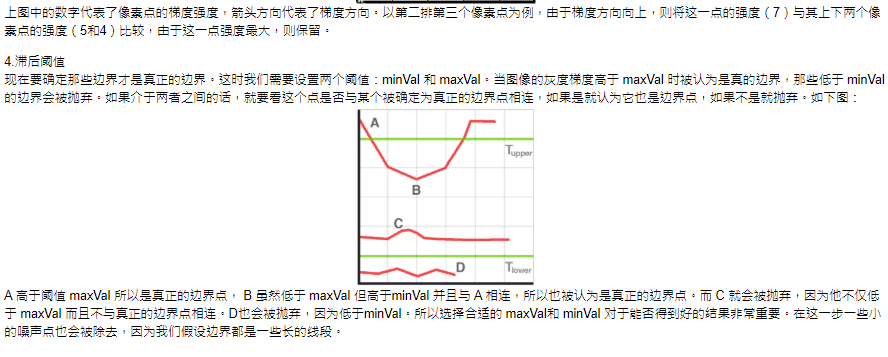
8.Canny边缘检测


#导入工具包
from imutils import *
image = imread('image/school.jpg')
show(image)

def edge_detection(image,minVal=100,maxVal=200):
    image = cv2.cvtColor(image, cv2.COLOR_RGB2GRAY)
    edges = cv2.Canny(image,minVal,maxVal)
    plt.imshow(edges,'gray')
    plt.axis('off')
    plt.show()

edge_detection(image)

image = imread('image/license_plate.png')
show(image)

edge_detection(image)

image = imread('image/bricks.png')
show(image)

edge_detection(image)

image = imread('image/coins.jpg')
show(image)

image = cv2.cvtColor(image, cv2.COLOR_RGB2GRAY)
image = cv2.GaussianBlur(image, (3,3), 0)
Value = [(10,150),(100,200),(180,230)]
plt.figure(figsize=(20,5))
for i,(minVal,maxVal) in enumerate(Value):
    plt.subplot(1,3,i+1)
    edges = cv2.Canny(image,minVal,maxVal)
    edges = cv2.GaussianBlur(edges, (3,3), 0)
    plt.imshow(edges,'gray')
    plt.title(str((minVal,maxVal)))
    plt.axis('off')
plt.show()

# 自动确定阈值的一种方法
def auto_canny(image, sigma=0.33):
    v = np.median(image)
    lower = int(max(0, (1.0-sigma) * v))
    upper = int(min(255, (1.0+sigma) * v))
    edged = cv2.Canny(image, lower, upper)
    print(lower,upper)
   return edged
edges = auto_canny(image)
edges = cv2.GaussianBlur(edges, (3,3), 0)
plt.imshow(edges,'gray')
plt.axis('off')
plt.show()


