配置Zabbix之监控Oracle数据库(Orabbix 方式)
配置Zabbix之监控Oracle数据库(Orabbix 方式)
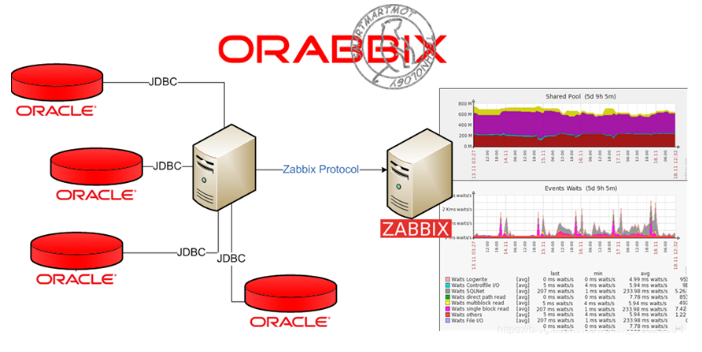
Orabbix是一个用来监控Oracle数据库性能的Zabbix插件工具,通过安装在被监控服务器上客户端上收集数据并传给Zabbix服务器端,然后通过调用图形显示。
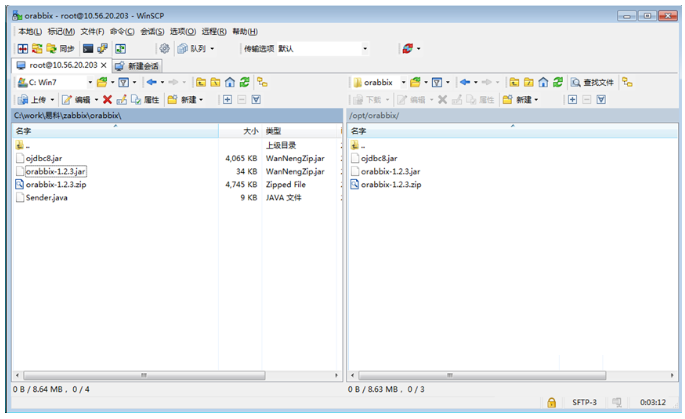
- 往zabbix服务器上传需要的组件:
Orabbix-1.2.3.zip :主要监控程序包,调用jdbc连接oracle数据库来提取性能指标。
Ojdbc8.jar: 用来替换orabbix-1.2.3.zip 展开后的ojdbc6.jar
Orabbix-1.2.3.jar :用来替换orabbix-1.2.3.zip 展开后的orabbix-1.2.3.jar
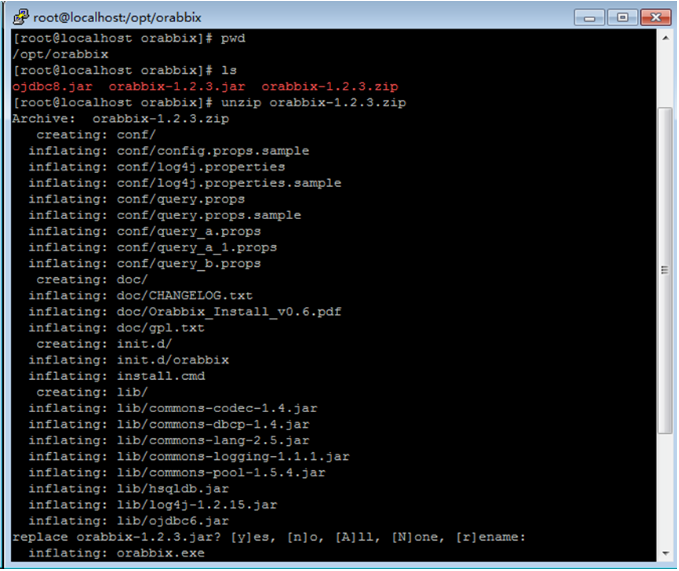
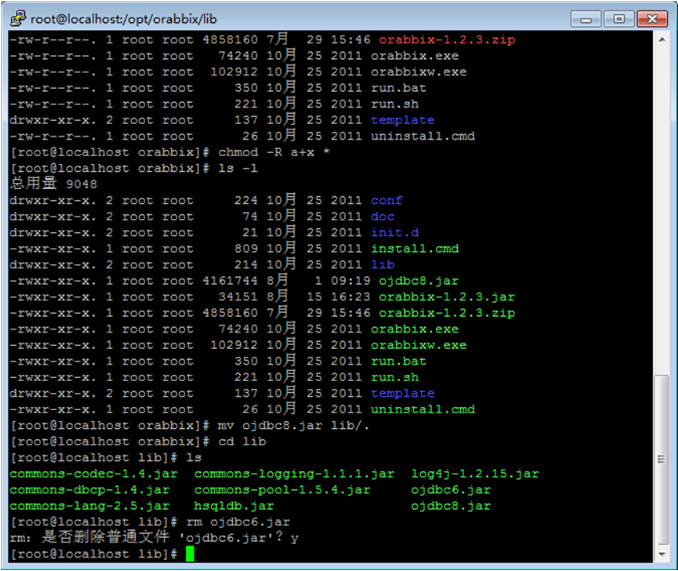
- 解压缩orabbix-1.2.3.zip文件
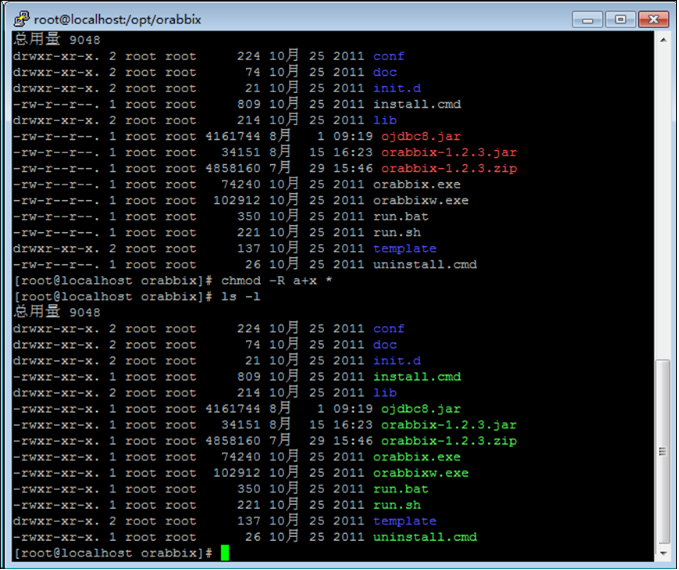
- 对程序增加可执行权限
- 复制ojdbc8.jar到lib目录下,同时删除lib 目录下的ojdbc6.jar
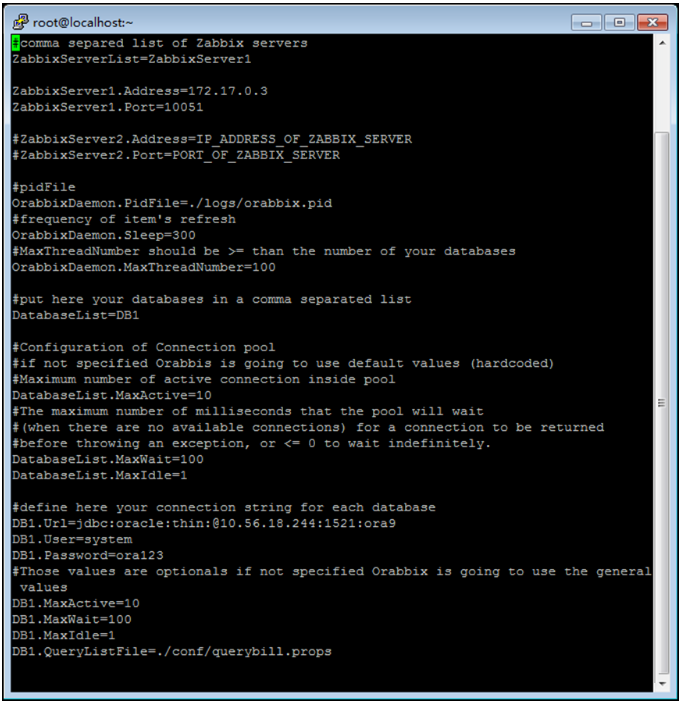
- 修改配置文件
cp /opt/orabbix/conf/config.props.sample /opt/orabbix/conf/config.props
同时定制化查询指标参数文件
vi /opt/orabbix/conf/querybill.props
DefaultQueryPeriod=2
QueryList=z_mydbfilesize,z_all_tables,z_pgahitper,z_poolshare,z_dic_CacheHitRatio,z_DeadLock,z_buf_HitRatio,z_pct_HitRatio
z_mydbfilesize.Query=select sum(bytes/1024/1024/10) from dba_data_files
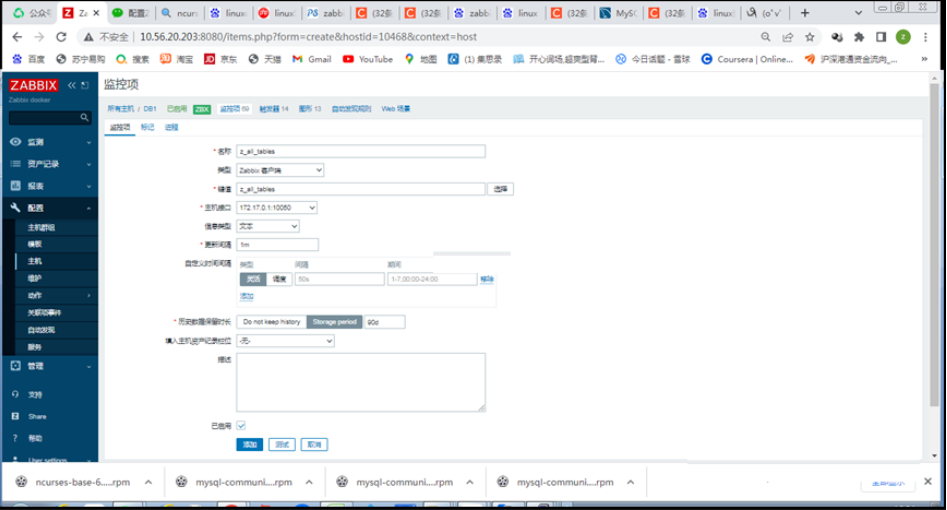
z_all_tables.Query=select count(*) from all_all_tables
z_pgahitper.Query=SELECT value FROM V$PGASTAT WHERE NAME='cache hit percentage'
z_poolshare.Query=select round(sum(pinhits-reloads)/sum(pins)*100,2) from v$librarycache
z_dic_CacheHitRatio.Query=SELECT ROUND(( 1 - SUM( getmisses ) / SUM( gets )) * 100, 1 ) FROM v$rowcache
z_DeadLock.Query=select count(*) from v$session where sid in (select session_id from v$locked_object)
z_buf_HitRatio.Query=select (1 - (sum(decode(name, 'physical reads',value,0)) / \
(sum(decode(name, 'db block gets',value,0)) + \
sum(decode(name, 'consistent gets',value,0))))) * 100 from v$sysstat
z_pct_HitRatio.Query=select round((100*b.value)/decode((a.value+b.value),0,1,(a.value+b.value)),2) \
from v$sysstat a, v$sysstat b where a.name = 'sorts (disk)' and b.name = 'sorts (memory)'
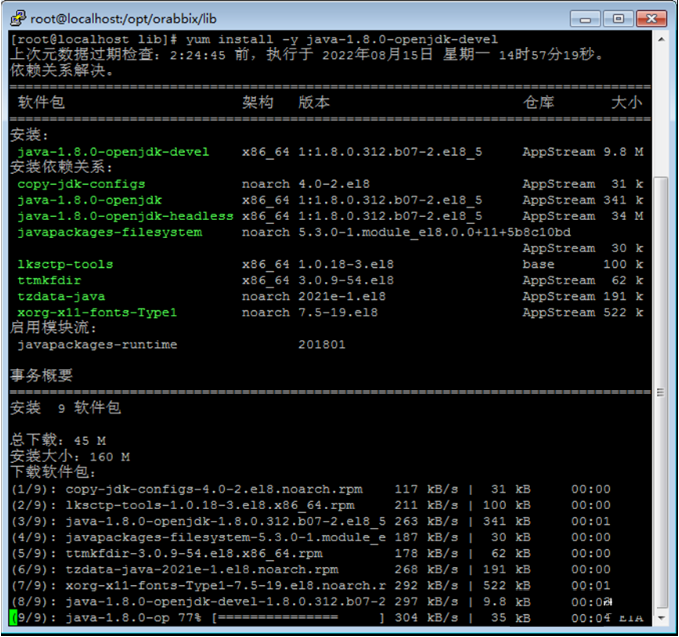
- 安装jdk
yum install -y java-1.8.0-openjdk-devel
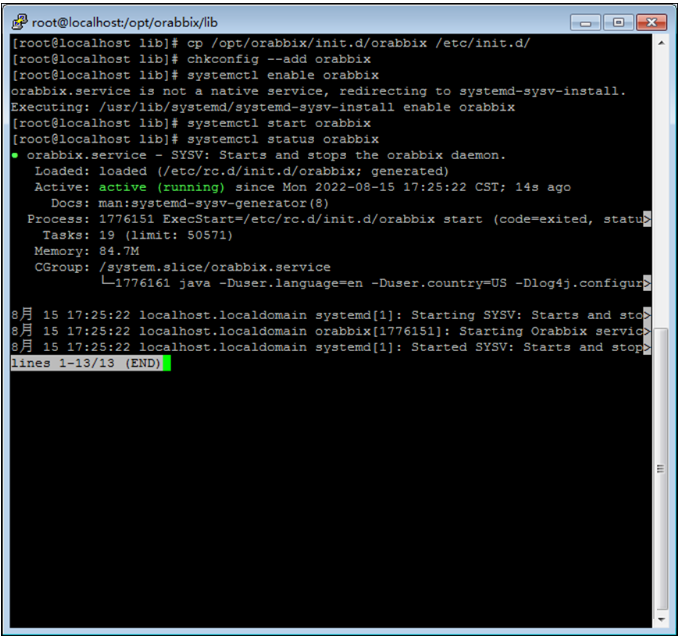
- 启动orabbix
cp /opt/orabbix/init.d/orabbix /etc/init.d/
chkconfig --add orabbix
systemctl enable orabbix
systemctl start orabbix
systemctl status orabbix
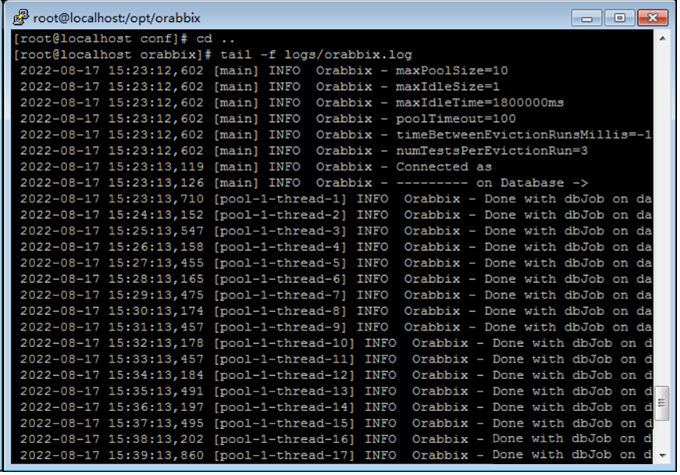
- 查看log
tail -f /opt/orabbix/logs/orabbix.log
- Zabbix server端设定
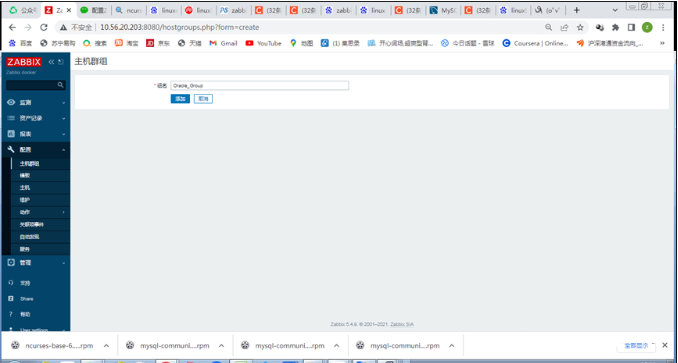
创建主机群组:Oracle_Group
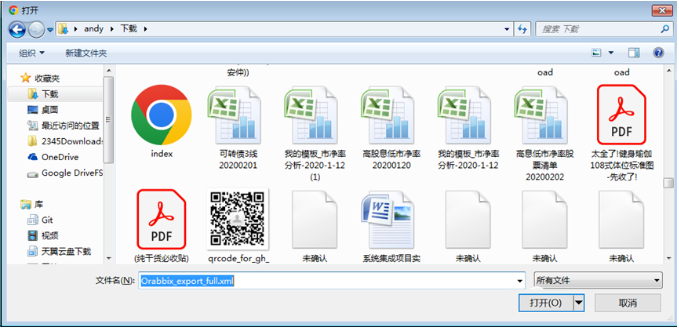
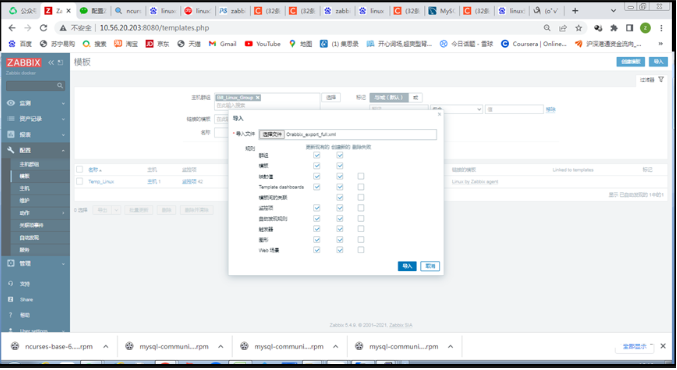
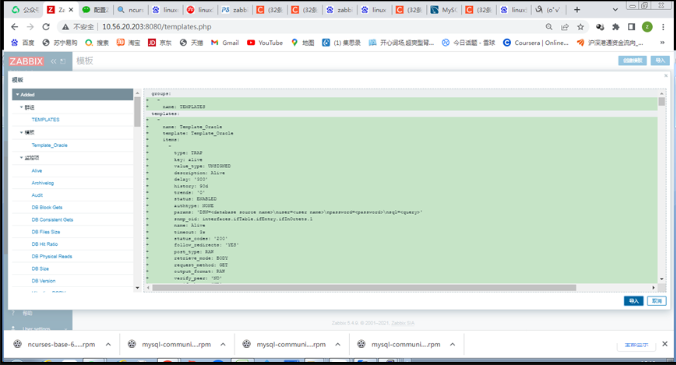
导入orabbix的oracle模版:orabbix_export_full.xml
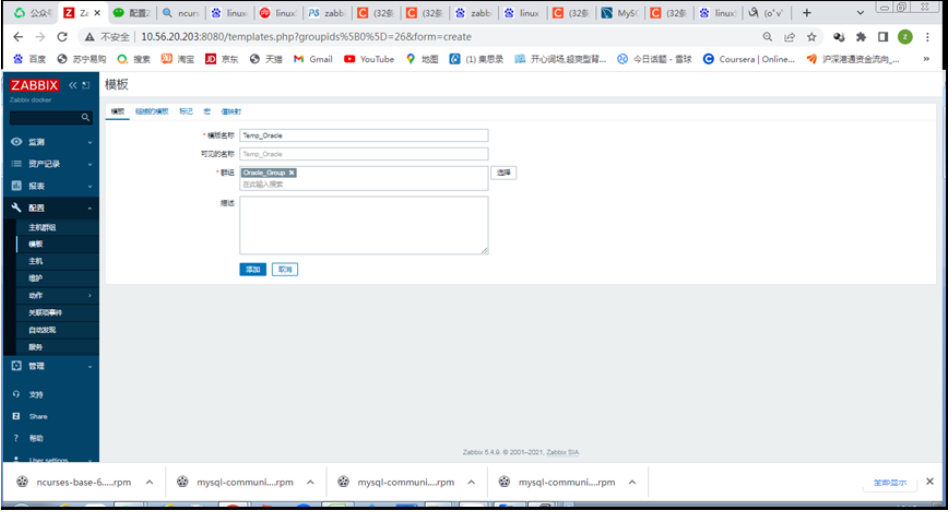
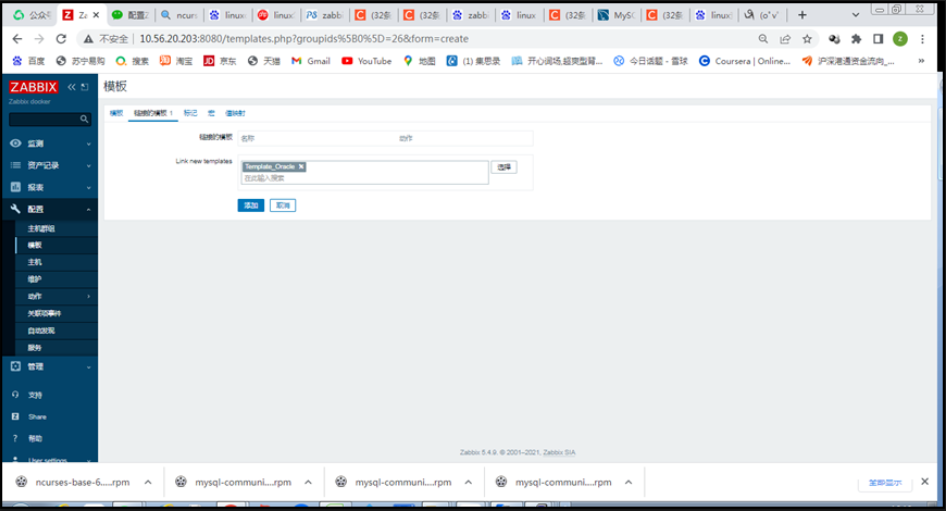
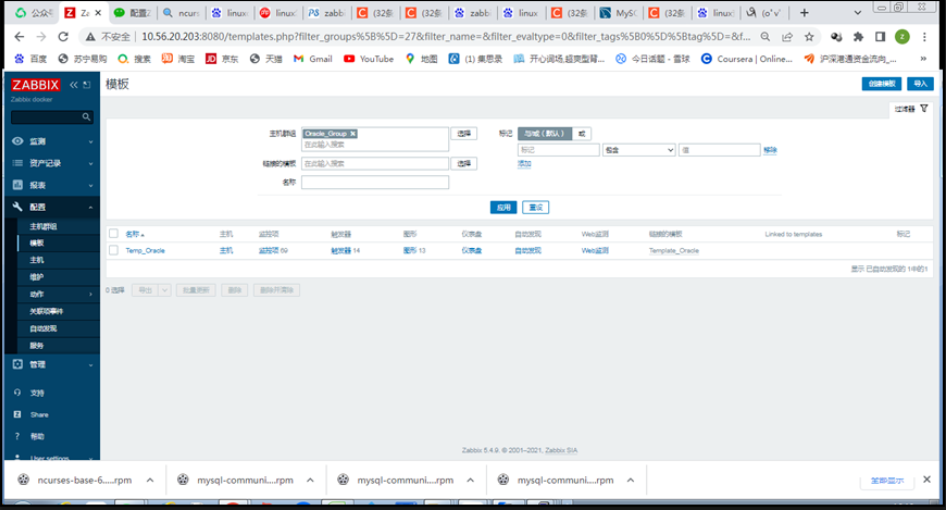
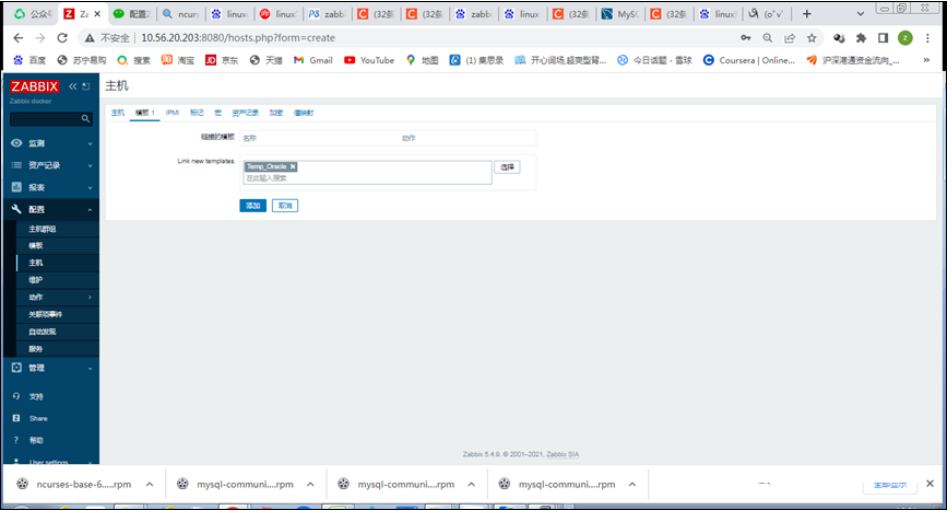
链接orabbix_export_full模版创建定制化模版:Temp_Oracle,加入到Oracle_Group 组中。
创建主机:DB1
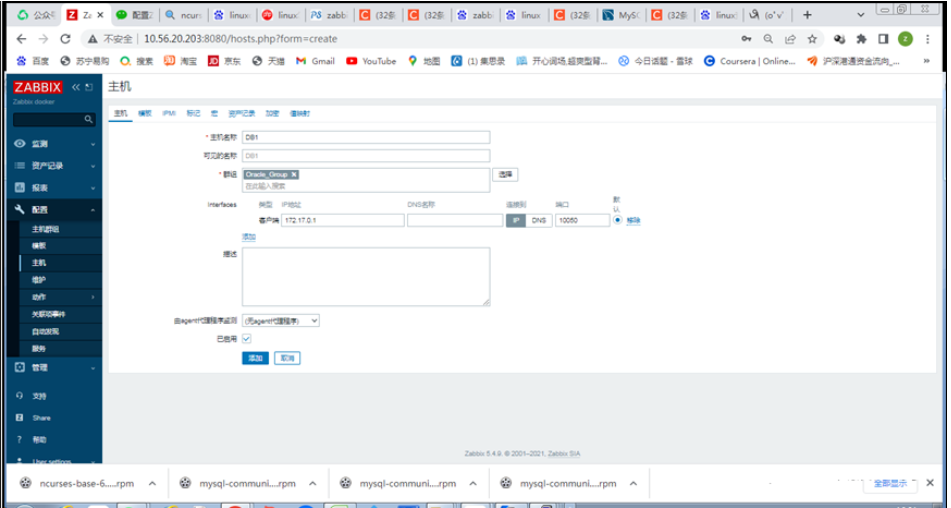
链接Temp_Oracle 模版
添加在定制化查询指标(querybill.props)里面的指标项目
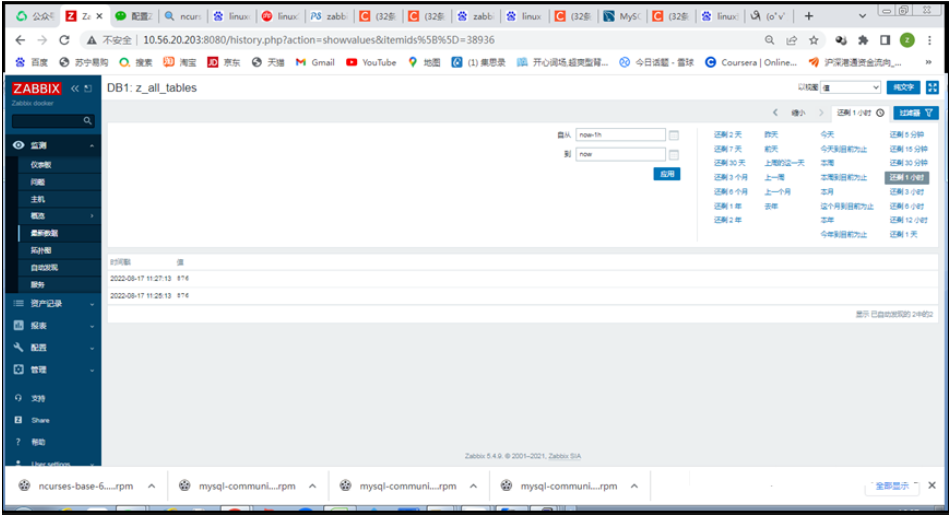
确认获得监控数据

 浙公网安备 33010602011771号