gdb 调试 symbol
I'm following linux bootloading using u-boot (using SPL falcon mode where u-boot-spl launches linux directly) on a qemu virtual machine. Now the code jumped to linux kernel and because I have done add-symbol-file vmlinux 0x80081000 I can follow the kernel code step by step using gdb connected to the virtual machine. Actually I loaded the kernel image to 0x80080000 but I had to set the address to 0x80081000 to make the source code appear on the gdb correctly according to the PC value(I don't know why this difference of 0x1000 is needed).
Later I found the kernel sets up the page table (identity mapping and swap table) and jumps to __primary_switched and this is where pure kernel virtual address is used first time for the PC. This is where the call is made at the end of the head.S file.
ldr x8, =__primary_switched
adrp    x0, __PHYS_OFFSET
br  x8
In the symbol file (vmlinux, an elf file), the symbols before __primary_switched are all mapped at virtual addresses (starting with 0xffffffc0..... high addresses) but the gdb could follow the source even when the PC value was using physical address. (The PC was initially loaded with physical address of the kernel start and PC relative jumps were being used until it jumps to __primary_switched, mmu disabled or using identity mapping) So does this mean, in doing add-symbol-file only the offset of the symbols from the start of text matters?
Another quetion : I can follow the kernel source with gdb but after __primary_switched, I cannot see the source. The debugger doesn't show the correct source location according to the now kernel virtual PC value. Should I tell the debugger to use correct offset using add-symbol-file again? if so how?
ADD (8:32 AM Wednesday, January 12, 2022, UTC)
I found from gdb manual,
"add-symbol-file filename [ -readnow | -readnever ] [ -o offset ] [ textaddress ] [ -s section address ... ] The add-symbol-file command reads additional symbol table information from the file filename. You would use this command when filename has been dynamically loaded (by some other means) into the program that is running. The textaddress parameter gives the memory address at which the file's text section has been loaded. You can additionally specify the base address of other sections using an arbitrary number of '-s section address' pairs. If a section is omitted, gdb will use its default addresses as found in filename. Any address or textaddress can be given as an expression. ..."
I changed my program a little bit to fix a problem. The readelf shows the .text section starting at ffffffc010080800. So I adjusted the command to "add-symbol-file vmlinux 0x80000800" and gdb shows the kernel source correct after jump to linux. Still it doesn't show me the source code after __primary_switched.
Section Headers:
  [Nr] Name              Type             Address           Offset
       Size              EntSize          Flags  Link  Info  Align
  [ 0]                   NULL             0000000000000000  00000000
       0000000000000000  0000000000000000           0     0     0
  [ 1] .head.text        PROGBITS         ffffffc010080000  00010000
       0000000000000040  0000000000000000  AX       0     0     4
  [ 2] .text             PROGBITS         ffffffc010080800  00010800
       0000000000304370  0000000000000000  AX       0     0     2048
  [ 3] .rodata           PROGBITS         ffffffc010390000  00320000
   .... (skip) ...
  [12] .notes            NOTE             ffffffc01045be18  003ebe18
       000000000000003c  0000000000000000   A       0     0     4
  [13] .init.text        PROGBITS         ffffffc010470000  003f0000
       0000000000027ec8  0000000000000000  AX       0     0     4
  [14] .exit.text        PROGBITS         ffffffc010497ec8  00417ec8
       000000000000046c  0000000000000000  AX       0     0     4
Since '__primary_switched' resides in section .init.text, I tried adding "-s .init.text 0xffffffc010470000" or "-s .init_text 0x803ef800"(physcial address) to the add-symbol-file command to no avail. Is my command wrong? Or could this be from page table (virtual -> Physical) problem because I see synchronous exception right after I enter __primary_switched (I see PC value has become 0x200. If the exception vector is located in 0x0, this is the vector entry for synch exception like undefined instruction. I should also check the vector base address has not been set correctly.)
I found my kernel load address was wrong (__PHYS_OFFSET was below physical ddr address start). After fixing it, the PC increments normally with kernel virtual address and I should just apply the add-symbol-file command using the virtual address.
This was the new section addresses.
        Section Headers:
          [Nr] Name              Type             Address           Offset
               Size              EntSize          Flags  Link  Info  Align
          [ 0]                   NULL             0000000000000000  00000000
               0000000000000000  0000000000000000           0     0     0
          [ 1] .head.text        PROGBITS         ffffffc010080000  00010000
               0000000000000040  0000000000000000  AX       0     0     4
          [ 2] .text             PROGBITS         ffffffc010080800  00010800
               0000000000304370  0000000000000000  AX       0     0     2048
          [ 3] .rodata           PROGBITS         ffffffc010390000  00320000
               00000000000a6385  0000000000000000  WA       0     0     4096
          [ 4] .modinfo          PROGBITS         ffffffc010436385  003c6385
               00000000000018ff  0000000000000000   A       0     0     1
          [ 5] .pci_fixup        PROGBITS         ffffffc010437c90  003c7c90
               00000000000020f0  0000000000000000   A       0     0     16
          [ 6] __ksymtab         PROGBITS         ffffffc010439d80  003c9d80
               0000000000006d20  0000000000000000   A       0     0     4
          [ 7] __ksymtab_gpl     PROGBITS         ffffffc010440aa0  003d0aa0
               0000000000005808  0000000000000000   A       0     0     4
          [ 8] __ksymtab_strings PROGBITS         ffffffc0104462a8  003d62a8
               00000000000134f2  0000000000000000   A       0     0     1
          [ 9] __param           PROGBITS         ffffffc0104597a0  003e97a0
               0000000000000b68  0000000000000000   A       0     0     8
          [10] __modver          PROGBITS         ffffffc01045a308  003ea308
               0000000000000cf8  0000000000000000   A       0     0     8
          [11] __ex_table        PROGBITS         ffffffc01045b000  003eb000
               0000000000000e18  0000000000000000   A       0     0     8
          [12] .notes            NOTE             ffffffc01045be18  003ebe18
               000000000000003c  0000000000000000   A       0     0     4
          [13] .init.text        PROGBITS         ffffffc010470000  003f0000
               0000000000027ec8  0000000000000000  AX       0     0     4
  [14] .exit.text        PROGBITS         ffffffc010497ec8  00417ec8
The final kernel image is loaded at 0x80080000. Then __PHYS_OFFSET becomes 0x80000000. (TEXT_OFFSET is 0x80000 by default). Now I can debug the kernel source before __primary_switch using this command.
add-symbol-file images/vmlinux 0x80080800 -s .head.text 0x80080000 -s .init.text 0x803f7800
And after the kernel entered __primary_switched (now kernel virtual address is used), I added this command to see the source and I can follow code using qemu and gdb step-by-step.
add-symbol-file images/vmlinux 0xffffffc010080800 -s .head.text 0xffffffc010080000 -s .init.text 0xffffffc010470000 Hope this helps someone later.
But after some days, I think I could just use add-symbol-file images/vmlinux 0xffffffc010080800 (applying all the section info).
https://wiki.stmicroelectronics.cn/stm32mpu/wiki/U-Boot_-_How_to_debug
linux 使用 gdb
gdb 对于看系统内部是非常有用. 在这个级别精通调试器的使用要求对 gdb 命令有信心, 需要理解目标平台的汇编代码, 以及对应源码和优化的汇编码的能力.
调试器必须把内核作为一个应用程序来调用. 除了指定内核映象的文件名之外, 你需要在 命令行提供一个核心文件的名子. 对于一个运行的内核, 核心文件是内核核心映象,
/proc/kcore. 一个典型的 gdb 调用看来如下:
gdb /usr/src/linux/vmlinux /proc/kcore
第一个参数是非压缩的 ELF 内核可执行文件的名子, 不是 zImage 或者 bzImage 或者给 启动环境特别编译的任何东东.
gdb 命令行的第二个参数是核心文件的名子. 如同任何 /proc 中的文件, /proc/kcore 是在被读的时候产生的. 当 read 系统调用在 /proc 文件系统中执行时, 它映射到一个 数据产生函数,而不是一个数据获取函数; 我们已经在本章"使用 /proc 文件系统"一节中 利用了这个特点. kcore 用来代表内核"可执行文件", 以一个核心文件的形式; 它是一个 巨大的文件, 因为他代表整个的内核地址空间, 对应于所有的物理内存. 从 gdb 中, 你 可查看内核变量,通过发出标准 gdb 命令. 例如, p jiffies 打印时钟的从启动到当前时 间的嘀哒数.
当你从 gdb 打印数据, 内核仍然在运行, 各种数据项在不同时间有不同的值; 然而, gdb 通过缓存已经读取的数据来优化对核心文件的存取. 如果你试图再次查看 jiffies 变量, 你会得到和以前相同的答案. 缓存值来避免额外的磁盘存取对传统核心文件是正确的做法, 但是在使用一个"动态"核心映象时就不方便. 解决方法是任何时候你需要刷新 gdb 缓存 时发出命令 core-file /proc/kcore; 调试器准备好使用新的核心文件并且丢弃任何旧信 息. 然而, 你不会一直需要发出 core-file 在读取一个新数据时; gdb 读取核心以多个 几 KB 的块的方式, 并且只缓存它已经引用的块.
gdb 通常提供的不少功能在你使用内核时不可用. 例如, gdb 不能修改内核数据; 它希望 在操作内存前在它自己的控制下运行一个被调试的程序. 也不可能设置断点或观察点, 或 者单步过内核函数.
注意, 为了给 gdb 符号信息, 你必须设置 CONFIG_DEBUG_INFO 来编译你的内核. 结果是 一个很大的内核映象在磁盘上, 但是, 没有这个信息, 深入内核变量几乎不可能.
有了调试信息, 你可以知道很多内核内部的事情. gdb 愉快地打印出结构, 跟随指针, 等 等. 而有一个事情比较难, 然而, 是检查 modules. 因为模块不是传递给 gdb 的 vmlinux 映象, 调试器对它们一无所知. 幸运的是, 作为 2.6.7 内核, 有可能教给 gdb 需要如何 检查可加载模块.
Linux 可加载模块是 ELF 格式的可执行映象; 这样, 它们被分成几个节. 一个典型的模 块可能包含一打或更多节, 但是有 3 个典型的与一次调试会话相关:
.text
这个节包含有模块的可执行代码. 调试器必须知道在哪里以便能够给出回溯或者设 置断点.( 这些操作都不相关, 当运行一个调试器在 /proc/kcore 上, 但是它们在 使用 kgdb 时可能有用, 下面描述).
.bss
.data
这 2 个节持有模块的变量. 在编译时不初始化的任何变量在 .bss 中, 而那些要 初始化的在 .data 里.
使 gdb 能够处理可加载模块需要通知调试器一个给定模块的节加载在哪里. 这个信息在 sysfs 中, 在 /sys/module 下. 例如, 在加载 scull 模块后, 目录
/sys/module/scull/sections 包含名子为 .text 的文件; 每个文件的内容是那个节的基 地址.
我们现在该发出一个 gdb 命令来告诉它关于我们的模块. 我们需要的命令是 add- symble-flile; 这个命令使用模块目标文件名, .text 基地址作为参数, 以及一系列描述 任何其他感兴趣的节安放在哪里的参数. 在深入位于 sysfs 的模块节数据后, 我们可以 构建这样一个命令:
(gdb) add-symbol-file .../scull.ko 0xd0832000 \
-s .bss 0xd0837100 \
-s .data 0xd0836be0
我们已经包含了一个小脚本在例子代码里( gdbline ), 它为给定的模块可以创建这个命 令.
我们现在使用 gdb 检查我们的可加载模块中的变量. 这是一个取自 scull 调试会话的快 速例子:
(gdb) add-symbol-file scull.ko 0xd0832000 \
-s .bss 0xd0837100 \
-s .data 0xd0836be0
add symbol table from file "scull.ko" at
.text_addr = 0xd0832000
.bss_addr = 0xd0837100
.data_addr = 0xd0836be0 (y or n) y
Reading symbols from scull.ko...done.
(gdb) p scull_devices[0]
$1 = {data = 0xcfd66c50, quantum = 4000,
qset = 1000,
size = 20881,
access_key = 0,
...}
这里我们看到第一个 scull 设备当前持有 20881 字节. 如果我们想, 我们可以跟随数据 链, 或者查看其他任何感兴趣的模块中的东东.
这是另一个值得知道的有用技巧:
(gdb) print *(address)
这里, 填充 address 指向的一个 16 进制地址; 输出是对应那个地址的代码的文件和行 号. 这个技术可能有用, 例如, 来找出一个函数指针真正指向哪里.
我们仍然不能进行典型的调试任务, 如设置断点或者修改数据; 为进行这些操作, 我们需 要使用象 kdb( 下面描述 ) 或者 kgdb ( 我们马上就到 )这样的工具.
https://blog.csdn.net/hushui/article/details/122702411
https://m2m-tele.com/wiki/
U-boot debugging. part 2.
In previous chapter we got U-boot debuggable. Partially debuggable as we turned out. The thing we missed is relocation. The workaround provided in that document is simple enough but not might be comfortable. Here suggested workaround adopted to NetSoM to get fully functional u-boot debugging procedure.
Command line mode debugging
- Start GDB server:
- Start GDB session:
that command has to be called from U-boot folder (build_dir/target-arm_cortex-a7+neon-vfpv4_musl_eabi/u-boot-wirelessroad_ecspi3/u-boot-2017.07 in our case) with u-boot image compiled with debugging symbols
- Connect to target device and load image:
(gdb) monitor reset
(gdb) monitor halt
(gdb) monitor sleep 200
(gdb) load
check that program counter set correctly:
1: /x $pc = 0x87800000
here 0x87800000 is starting address u-boot image is placed.
- Restore device tree binary blob:
Restoring binary file u-boot.dtb into memory (0x87882d68 to 0x8788953b)
That address here is the end address of image. It need to be done as in production mode (without debugger) U-boot checks for device tree binary blob at the address placed right after image:
-rw-rw-r– 1 al al 26579 окт 22 17:19 u-boot.dtb
-rw-rw-r– 1 al al 562491 окт 24 14:26 u-boot-dtb.bin
-rwxrwxr-x 1 al al 535912 окт 24 14:26 u-boot-nodtb.bin
here you see size of u-boot-nodtb.bin (u-boot image without dtb appended to the end) = 535912 = 0x82D68.
So if you will add it to the starting address of u-boot being placed: 0x82D68 + 0x87800000 = 0x87882D688 you will get it. Binary blob of dts – u-boot.dtb has size 26579. Being appended to u-boot-nodtb.bin (size 535912) gives you u-boot-dtb.bin (size 562491).
Another way to get this address – you can check for value of __end address in u-boot.map file:
*(.__end)
.__end 0x0000000087882d68 0x0 arch/arm/lib/built-in.o
- Set breakpoint at relocate_code to prevent jumping to unprepared memory area and start execution:
(gdb) b relocate_code
Breakpoint 1 at 0x87802db4: file arch/arm/lib/relocate.S, line 81.
(gdb) c
Continuing.
Breakpoint 1, relocate_code () at arch/arm/lib/relocate.S:81
81 stmdb sp!, {lr}
1: /x $pc = 0x87802db4
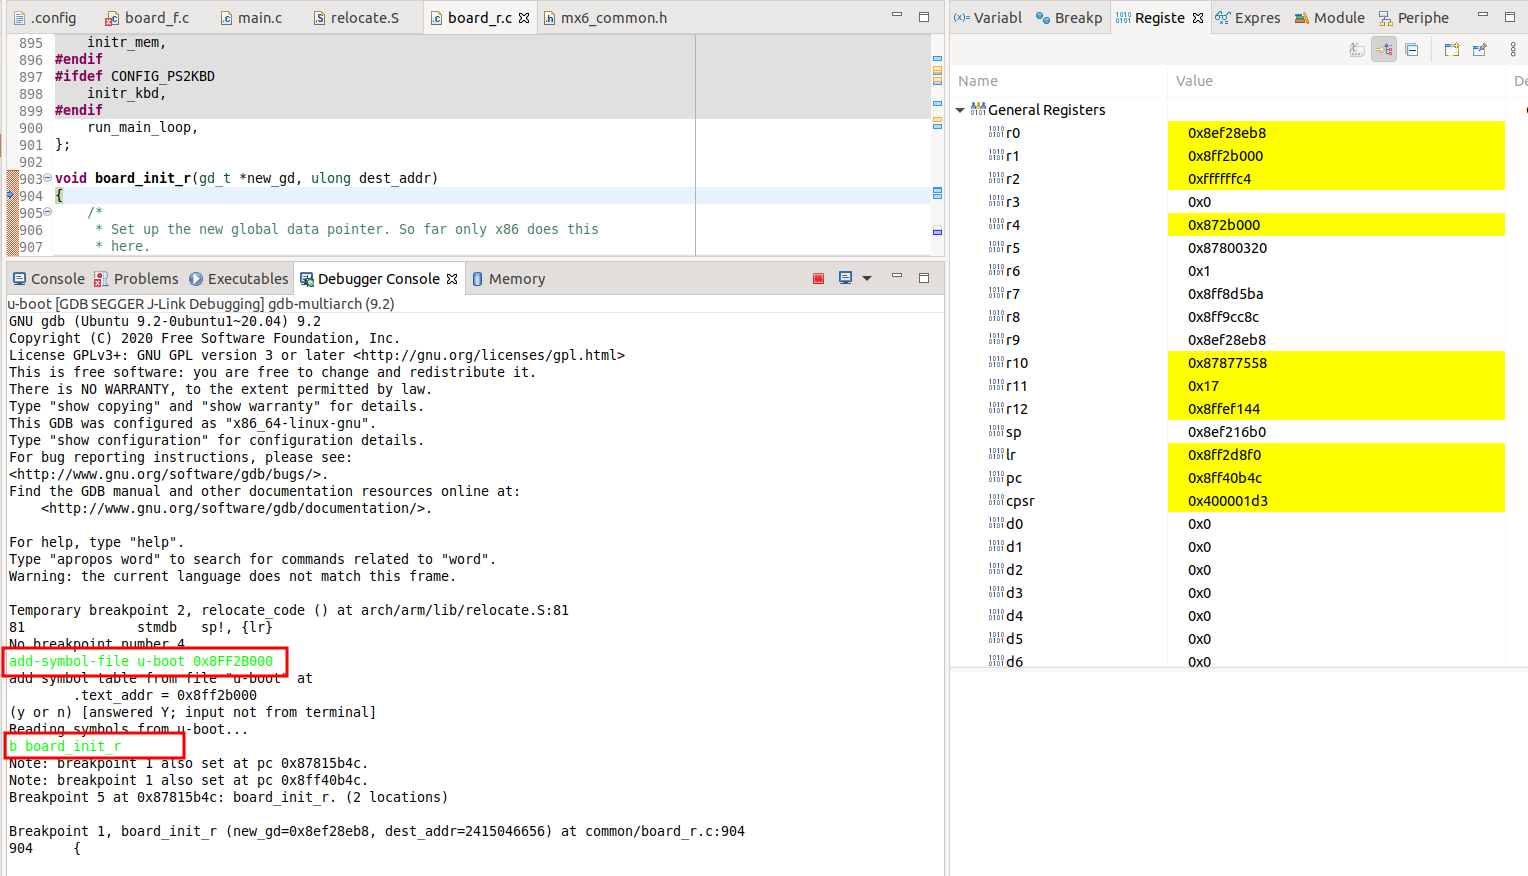
at this moment program counter passed for board_init_f initialization procedure so we can place symbol file at target memory area program counter going to jump:
add symbol table from file “u-boot” at
.text_addr = 0x8ff2b000
(y or n) y
Reading symbols from u-boot…
without it you can continue executeion. Nothing brakes but you will not be able to set breakpoints as they will be placed in memory area starting from 0x87800000 u-boot image place initially while actual execution will be at relocated area starting from 0x8FF2B000. So by adding debugging symbols by new address you will get duplicated addresses for each debugging symbol:
Breakpoint 2 at 0x87815b4c: board_init_r. (2 locations)
and now is time for controlled jump:
2: /x $pc = 0x87802db4
(gdb) fin
Run till exit from #0 relocate_code () at arch/arm/lib/relocate.S:81
_main () at arch/arm/lib/crt0.S:116
116 bl relocate_vectors
1: /x $pc = 0x8ff2d8cc
2: /x $pc = 0x8ff2d8cc
(gdb) display /x $pc
3: /x $pc = 0x8ff2d8cc
here we check for program counter before relocate_code function being executed – 0x87802db4 and after – 0x8ff2d8cc. As you see we jumped to new memory area. Continue execution:
(gdb) c
Continuing.
Breakpoint 2, board_init_r (new_gd=0x8ef28eb8, dest_addr=2415046656) at common/board_r.c:904
904 {
1: /x $pc = 0x8ff40b4c
2: /x $pc = 0x8ff40b4c
3: /x $pc = 0x8ff40b4c
Still able to catch PC by breakpoints.
How to determine relocation address? Explained in same document mentioned above. You can check it by typing bdinfo command in u-boot console:
arch_number = 0x00000000
boot_params = 0x80000100
DRAM bank = 0x00000000
-> start = 0x80000000
-> size = 0x10000000
eth0name = FEC
ethaddr = 86:72:04:c5:7e:83
current eth = FEC
ip_addr = 192.168.31.99
baudrate = 115200 bps
TLB addr = 0x8FFF0000
relocaddr = 0x8FF2B000
reloc off = 0x0872B000
irq_sp = 0x8EF216C0
sp start = 0x8EF216B0
Early malloc usage: 188 / 400
fdt_blob = 8ef216d8
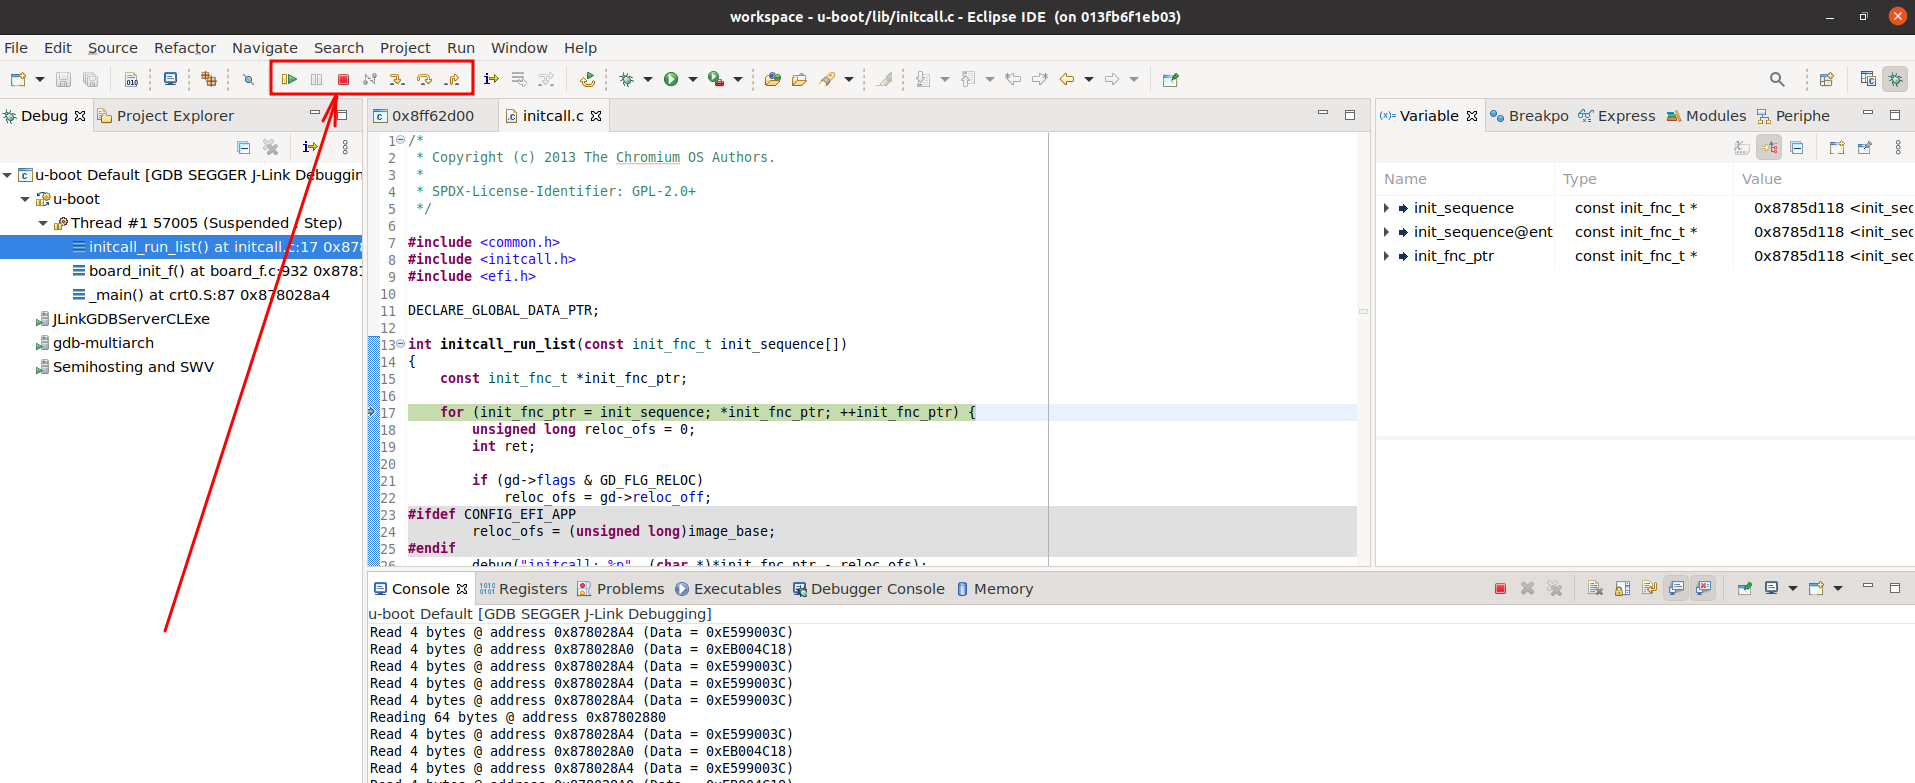
here relocaddr is memory address u-boot going to relocate itself and fdt_blob – address device tree binary blob to be found. Another way to get relocation address is interrupt execution of u-boot under debugger and type following:
^C
Program received signal SIGTRAP, Trace/breakpoint trap.
0x8ff62d00 in mxc_serial_getc () at drivers/serial/serial_mxc.c:161
161 while (__REG(UART_PHYS + UTS) & UTS_RXEMPTY)
1: /x $pc = 0x8ff62d00
2: /x $pc = 0x8ff62d00
3: /x $pc = 0x8ff62d00
(gdb) p /x gd->relocaddr
$1 = 0x8ff2b000
Doing same in Eclipse.
in eclipse we have to provide same commands to load dtb blob, to set breakpoint:
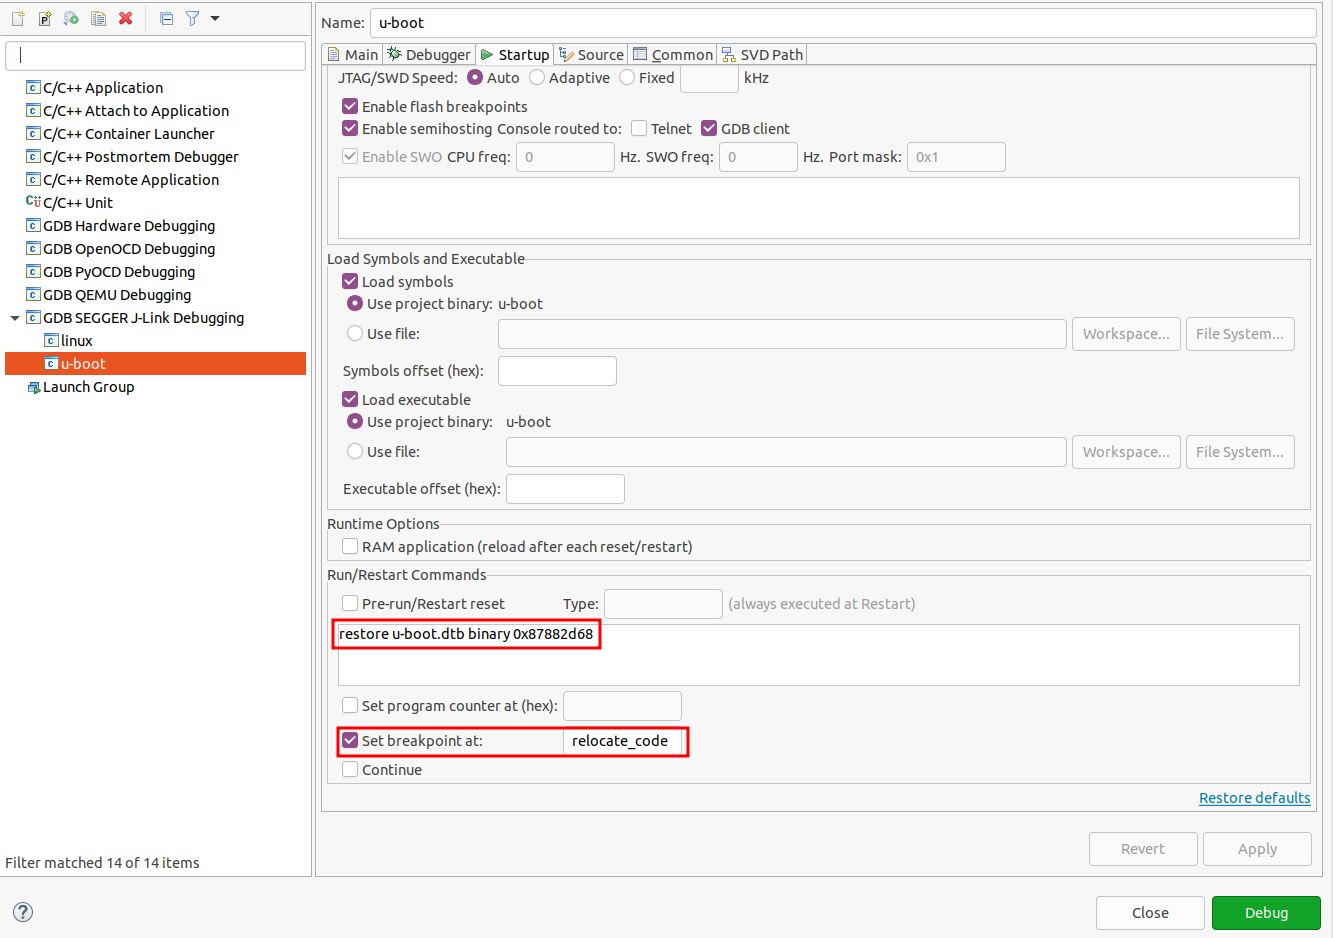
Then we have to start execution:
it should stop at relocate_code function. Same commands we entered to load debugging symbols to relocation are to be entered here in Debugger console:
Continue execution and it will stop at board_init_r function.
So, finally we got fully debuggable and controllable u-boot. Next time we will pass u-boot initialization procedure from start till the end to learn how it is.
U-boot initialization sequence
gdb load多個symbol的方法
load symbol可以用 add-symbol-file 指令
例如用
add-symbol-file rom.adx 0x8000
表示把 rom.adx 的symbol以 .text 為0x8000 base 載入 (其他section會跟著調整)
詳細功能可以在gdb用 help add-symbol-file 查
---------------------------------------------------
第1個adx檔用file
file xxx.adx (file會清掉之前的所有symbol)
第2個之後用add-symbol-file
如
add-symbol-file rom.adx 0x8000
其中0x8000是rom.adx檔的.text base
如果加入的不是.text而是其他section。
要個別打入section的名稱及位址。請參考下面的說明。
(gdb) help add-symbol-file
Load symbols from FILE, assuming FILE has been dynamically loaded.
Usage: add-symbol-file FILE ADDR [-s <SECT> <SECT_ADDR> -s <SECT> <SECT_ADDR> ..
.]
ADDR is the starting address of the file's text.
The optional arguments are section-name section-address pairs and
should be specified if the data and bss segments are not contiguous
with the text. SECT is a section name to be loaded at SECT_ADDR.
(gdb)
example
hylai@APC002 /cygdrive/d/mycode/patch
$ nds32le-elf-gdb.exe
GNU gdb (2012-03-16) 6.8
Copyright (C) 2008 Free Software Foundation, Inc.
License GPLv3+: GNU GPL version 3 or later <http://gnu.org/licenses/gpl.html>
This is free software: you are free to change and redistribute it.
There is NO WARRANTY, to the extent permitted by law. Type "show copying"
and "show warranty" for details.
This GDB was configured as "--host=i686-mingw32 --target=nds32le-elf".
source E:\Andestech\AndeSight200MCU\toolchains\nds32le-elf-newlib-v2\bin\.Andes
dbinit
(gdb) target remote:1234
Remote debugging using :1234
0x00016e02 in ?? ()
core0(gdb) target remote:1234
A program is being debugged already. Kill it? (y or n) y
Remote debugging using :1234
0x00016da6 in ?? ()
core0(gdb) file mainprog.adx
A program is being debugged already.
Are you sure you want to change the file? (y or n) y
Reading symbols from d:\mycode\patch\mainprog.adx...done.
core0(gdb) load
Loading section .nds32_init, size 0x4 lma 0x500000
Loading section .init, size 0xc lma 0x500004
Loading section .text, size 0x9518 lma 0x500010
Loading section .rodata, size 0x338 lma 0x509528
Loading section .eh_frame, size 0x34 lma 0x509860
Loading section .ctors, size 0x4 lma 0x509894
Loading section .dtors, size 0x4 lma 0x509898
Loading section .jcr, size 0x4 lma 0x50989c
Loading section .data, size 0x870 lma 0x5098a0
Loading section .sdata_w, size 0x38 lma 0x50a110
Loading section .sdata_b, size 0x3 lma 0x50a148
Loading section FUNC_TABLE, size 0xc lma 0x510000
Start address 0x500010, load size 41303
Transfer rate: 433 KB/sec, 2950 bytes/write.
core0(gdb) file patch.adx
A program is being debugged already.
Are you sure you want to change the file? (y or n) y
Load new symbol table from "d:\mycode\patch\patch.adx"? (y or n) y
Reading symbols from d:\mycode\patch\patch.adx...done.
core0(gdb) load
Loading section FUNC_TABLE, size 0xc lma 0x510000
Loading section FUNC_PATCH, size 0x38 lma 0x510020
Start address 0x500010, load size 68
Transfer rate: 544 bits in <1 sec, 34 bytes/write.
core0(gdb) file mainprog.adx
A program is being debugged already.
Are you sure you want to change the file? (y or n) y
Load new symbol table from "d:\mycode\patch\mainprog.adx"? (y or n) y
Reading symbols from d:\mycode\patch\mainprog.adx...done.
core0(gdb)add-symbol-file patch.adx 0x500000 -s FUNC_TABLE 0x510000 -s FUNC_PATCH 0x510020
add symbol table from file "patch.adx" at
.text_addr = 0x500000
FUNC_TABLE_addr = 0x510000
FUNC_PATCH_addr = 0x510020
(y or n) y
Reading symbols from d:\mycode\patch\patch.adx...warning: Lowest section in d:\
ycode\patch\patch.adx is FUNC_TABLE at 00510000
warning: section .text not found in d:\mycode\patch\patch.adx
done.
core0(gdb) set $pc=0x500000
core0(gdb) b main
Breakpoint 1 at 0x50010c: file ../main.c, line 20.
core0(gdb) c
Continuing.
Breakpoint 1, main () at ../main.c:20
20 printf("func1(30)=%d\n",jump_table.func_a(30));
core0(gdb) s
func1 (x=30) at ../main.c:28
28 return x*num1;
core0(gdb) n
29 }
core0(gdb) s
main () at ../main.c:21
21 printf("func2(30)=%d\n",jump_table.func_b(30));
core0(gdb) s
func2 (x=30) at ../patchprog.c:24
24 return x*num2*100;
core0(gdb)
https://www.codenong.com/33049201/
Examining the Symbol Table
The commands described in this chapter allow you to inquire about the symbols (names of variables, functions and types) defined in your program. This information is inherent in the text of your program and does not change as your program executes. GDB finds it in your program's symbol table, in the file indicated when you started GDB (see section Choosing files), or by one of the file-management commands (see section Commands to specify files).
Occasionally, you may need to refer to symbols that contain unusual characters, which GDB ordinarily treats as word delimiters. The most frequent case is in referring to static variables in other source files (see section Program variables). File names are recorded in object files as debugging symbols, but GDB would ordinarily parse a typical file name, like `foo.c', as the three words `foo' `.' `c'. To allow GDB to recognize `foo.c' as a single symbol, enclose it in single quotes; for example,
p 'foo.c'::x
looks up the value of x in the scope of the file `foo.c'.
info address symbol- Describe where the data for symbol is stored. For a register variable, this says which register it is kept in. For a non-register local variable, this prints the stack-frame offset at which the variable is always stored. Note the contrast with `print &symbol', which does not work at all for a register variable, and for a stack local variable prints the exact address of the current instantiation of the variable.
info symbol addr- Print the name of a symbol which is stored at the address addr. If no symbol is stored exactly at addr, GDB prints the nearest symbol and an offset from it:
(gdb) info symbol 0x54320
_initialize_vx + 396 in section .text
This is the opposite of theinfo addresscommand. You can use it to find out the name of a variable or a function given its address. whatis expr- Print the data type of expression expr. expr is not actually evaluated, and any side-effecting operations (such as assignments or function calls) inside it do not take place. See section Expressions.
whatis- Print the data type of
$, the last value in the value history. ptype typename- Print a description of data type typename. typename may be the name of a type, or for C code it may have the form `class class-name', `struct struct-tag', `union union-tag' or `enum enum-tag'.
ptype exprptype- Print a description of the type of expression expr.
ptypediffers fromwhatisby printing a detailed description, instead of just the name of the type. For example, for this variable declaration:struct complex {double real; double imag;} v;the two commands give this output:(gdb) whatis v type = struct complex (gdb) ptype v type = struct complex { double real; double imag; }As withwhatis, usingptypewithout an argument refers to the type of$, the last value in the value history. info types regexpinfo types- Print a brief description of all types whose names match regexp (or all types in your program, if you supply no argument). Each complete typename is matched as though it were a complete line; thus, `i type value' gives information on all types in your program whose names include the string
value, but `i type ^value$' gives information only on types whose complete name isvalue. This command differs fromptypein two ways: first, likewhatis, it does not print a detailed description; second, it lists all source files where a type is defined. info scope addr- List all the variables local to a particular scope. This command accepts a location--a function name, a source line, or an address preceded by a `*', and prints all the variables local to the scope defined by that location. For example:
(gdb) info scope command_line_handler
Scope for command_line_handler:
Symbol rl is an argument at stack/frame offset 8, length 4.
Symbol linebuffer is in static storage at address 0x150a18, length 4.
Symbol linelength is in static storage at address 0x150a1c, length 4.
Symbol p is a local variable in register $esi, length 4.
Symbol p1 is a local variable in register $ebx, length 4.
Symbol nline is a local variable in register $edx, length 4.
Symbol repeat is a local variable at frame offset -8, length 4.
This command is especially useful for determining what data to collect during a trace experiment, see section Tracepoint Action Lists. info source- Show the name of the current source file--that is, the source file for the function containing the current point of execution--and the language it was written in.
info sources- Print the names of all source files in your program for which there is debugging information, organized into two lists: files whose symbols have already been read, and files whose symbols will be read when needed.
info functions- Print the names and data types of all defined functions.
info functions regexp- Print the names and data types of all defined functions whose names contain a match for regular expression regexp. Thus, `info fun step' finds all functions whose names include
step; `info fun ^step' finds those whose names start withstep. info variables- Print the names and data types of all variables that are declared outside of functions (i.e., excluding local variables).
info variables regexp- Print the names and data types of all variables (except for local variables) whose names contain a match for regular expression regexp. Some systems allow individual object files that make up your program to be replaced without stopping and restarting your program. For example, in VxWorks you can simply recompile a defective object file and keep on running. If you are running on one of these systems, you can allow GDB to reload the symbols for automatically relinked modules:
set symbol-reloading on- Replace symbol definitions for the corresponding source file when an object file with a particular name is seen again.
set symbol-reloading off- Do not replace symbol definitions when encountering object files of the same name more than once. This is the default state; if you are not running on a system that permits automatic relinking of modules, you should leave
symbol-reloadingoff, since otherwise GDB may discard symbols when linking large programs, that may contain several modules (from different directories or libraries) with the same name. show symbol-reloading- Show the current
onoroffsetting.
set opaque-type-resolution on- Tell GDB to resolve opaque types. An opaque type is a type declared as a pointer to a
struct,class, orunion---for example,struct MyType *---that is used in one source file although the full declaration ofstruct MyTypeis in another source file. The default is on. A change in the setting of this subcommand will not take effect until the next time symbols for a file are loaded. set opaque-type-resolution off- Tell GDB not to resolve opaque types. In this case, the type is printed as follows:
{<no data fields>} show opaque-type-resolution- Show whether opaque types are resolved or not.
maint print symbols filenamemaint print psymbols filenamemaint print msymbols filename- Write a dump of debugging symbol data into the file filename. These commands are used to debug the GDB symbol-reading code. Only symbols with debugging data are included. If you use `maint print symbols', GDB includes all the symbols for which it has already collected full details: that is, filename reflects symbols for only those files whose symbols GDB has read. You can use the command
info sourcesto find out which files these are. If you use `maint print psymbols' instead, the dump shows information about symbols that GDB only knows partially--that is, symbols defined in files that GDB has skimmed, but not yet read completely. Finally, `maint print msymbols' dumps just the minimal symbol information required for each object file from which GDB has read some symbols. See section Commands to specify files, for a discussion of how GDB reads symbols (in the description ofsymbol-file).

 浙公网安备 33010602011771号