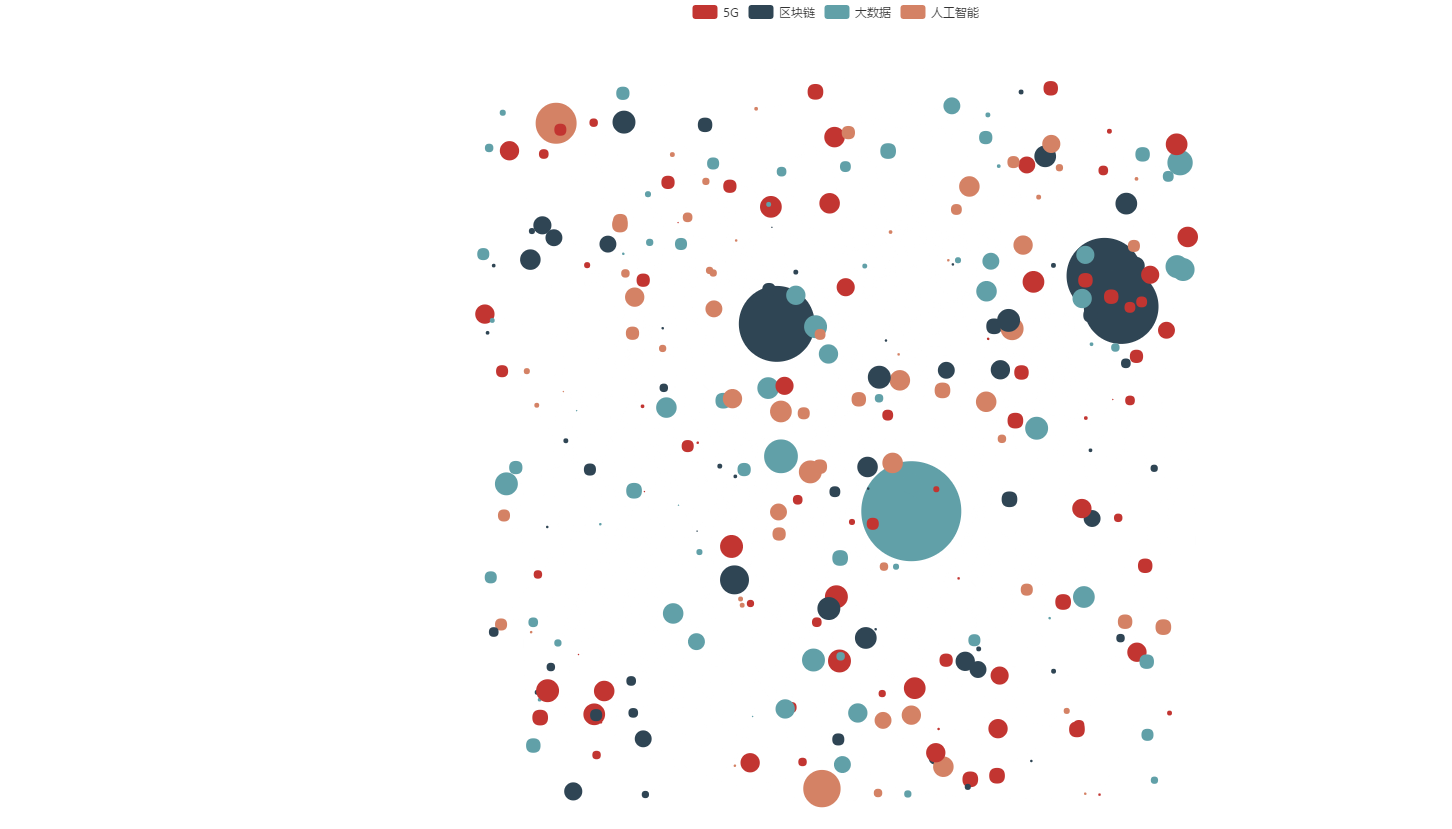
<%@ page language="java" contentType="text/html; charset=UTF-8"
    pageEncoding="UTF-8"%>
<!DOCTYPE html>
<html style="height: 100%">
<head>
<meta charset="UTF-8">
<title>Insert title here</title>
</head>
<body style="height: 100%; margin: 0">
<div id="container" style="height: 100%"></div>
       <script type="text/javascript" src="assets/js/echarts.js"></script>
       <script type="text/javascript" src="assets/js/jquery-3.3.1.js"></script>
       <script type="text/javascript" src="assets/js/dataTool.js"></script>
       <script type="text/javascript">
       var dom = document.getElementById("container");
       var myChart = echarts.init(dom);
       var app = {};
       option = null;
       myChart.showLoading();
       $.getJSON('data/text4.json', function (json) {
           myChart.hideLoading();

           var graph = json;
           var categories = [{name: '5G'}, {name: '区块链'}, {name: '大数据'}, {name: '人工智能'}];
           var all_divide = graph.nodes[0].symbolSize/100;
           graph.nodes.forEach(function (node) {
               node.itemStyle = null;
               node.value = node.symbolSize;
               node.symbolSize /= all_divide;
               node.category = node.attributes.modularity_class;
           });
           option = {
               title: {
                   text: 'Les Miserables',
                   subtext: 'Default layout',
                   y: 'bottom',
                   x: 'right'
               },
               tooltip: {

               },
               legend: [{
                   // selectedMode: 'single',
                   data: categories.map(function (a) {
                       return a.name;
                   })
               }],
               animationDuration: 1500,
               animationEasingUpdate: 'quinticInOut',
               series: [
                   {
                       name: 'Les Miserables',
                       type: 'graph',
                       layout: "none",            // 图的布局。[ default: 'none' ]
                       data: graph.nodes,
                       links: graph.links,
                       categories: categories,
                       roam: true,
                       focusNodeAdjacency: true,   // 是否在鼠标移到节点上的时候突出显示节点以及节点的边和邻接节点。[ default: false ]
                       label: { //=============图形上的文本标签
                           normal: {
                               show: false,//是否显示标签。
                           },
                           emphasis: {//高亮状态
                               show: true,//是否显示标签。
                               position: 'right',//标签的位置。['50%', '50%'] [x,y]
                               // textStyle: { //标签的字体样式
                               //     color: '#000', //字体颜色
                               //     fontStyle: 'normal',//文字字体的风格 'normal'标准 'italic'斜体 'oblique' 倾斜
                               //     fontWeight: 'bolder',//'normal'标准'bold'粗的'bolder'更粗的'lighter'更细的或100 | 200 | 300 | 400...
                               //     fontFamily: 'sans-serif', //文字的字体系列
                               //     fontSize: 12, //字体大小
                               // }
                           }
                       },
                       edgeLabel: {//==============线条的边缘标签
                           normal: {
                               show: false
                           },
                           emphasis: {//高亮状态
                           }
                       },
                       lineStyle: {
                           normal: {
                               color: '#F5F5F5',          // 线的颜色[ default: '#aaa' ]
                               width: 0.1,               // 线宽[ default: 1 ]
                               type: 'solid',          // 线的类型[ default: solid ]   'dashed'    'dotted'
                               opacity: 0.1,           // 图形透明度。支持从 0 到 1 的数字,为 0 时不绘制该图形。[ default: 0.5 ]
                               curveness: 0.3
                           },
                           emphasis: {//高亮状态
                               color: '#000',          // 线的颜色[ default: '#aaa' ]
                               width: 0.1,               // 线宽[ default: 1 ]
                               opacity: 0.8,           // 图形透明度。支持从 0 到 1 的数字,为 0 时不绘制该图形。[ default: 0.5 ]
                           }
                       }
                   }
               ]
           };

           myChart.setOption(option);
       }, 'json');
       if (option && typeof option === "object") {
           var startTime = +new Date();
           myChart.setOption(option, true);
           var endTime = +new Date();
           var updateTime = endTime - startTime;
           console.log("Time used:", updateTime);
       }
       </script>
</body>
</html>


