ggplot2绘制采样地,手动批量指定颜色、性状、大小、设置图例
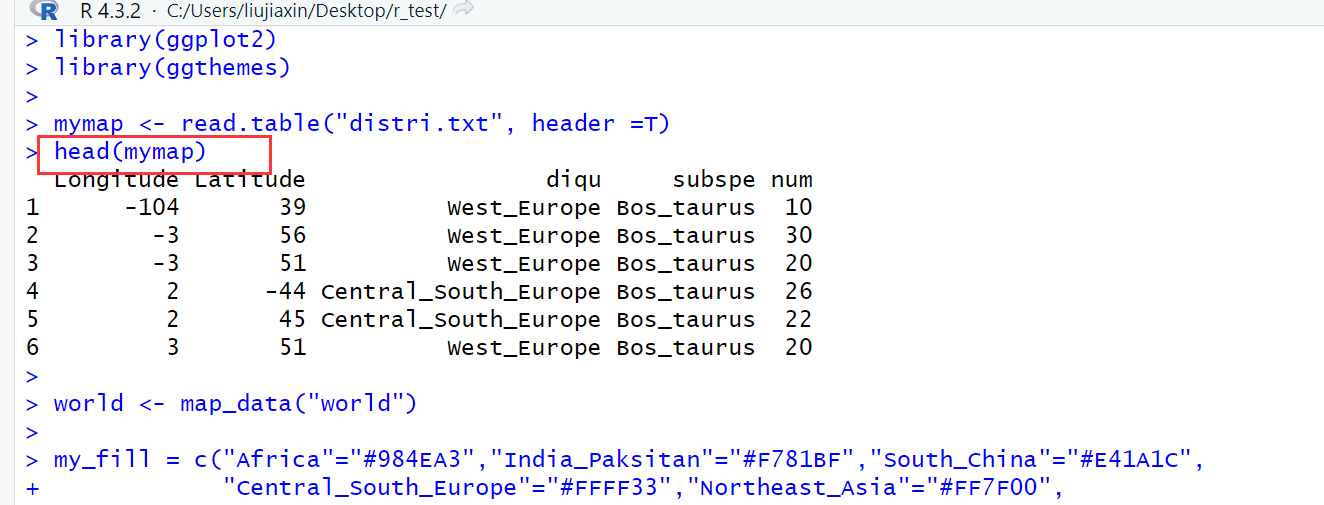
001、原始数据
Longitude   Latitude    diqu    subspe  num
-104    39  West_Europe Bos_taurus  10
-3  56  West_Europe Bos_taurus  30
-3  51  West_Europe Bos_taurus  20
2   -44 Central_South_Europe    Bos_taurus  26
2   45  Central_South_Europe    Bos_taurus  22
3   51  West_Europe Bos_taurus  20
5   43  Central_South_Europe    Bos_taurus  20
7   45  Central_South_Europe    Bos_taurus  8
7   46  Central_South_Europe    Bos_taurus  30
12  49  Central_South_Europe    Bos_taurus  23
29  1   Africa  Bos_taurus_Bos_indicus  17
36  3   Africa  Bos_taurus_Bos_indicus  5
44  36  The_Middle_East_Northwest_China Bos_taurus_Bos_indicus  8
70  -20 India_Paksitan  Bos_indicus 10
71  30  India_Paksitan  Bos_indicus 4
75  32  India_Paksitan  Bos_indicus 20
77  28  India_Paksitan  Bos_indicus 5
80  43  Northwest_China Bos_taurus  11
87  43  Northwest_China Bos_taurus  30
90  38  Northwest_China Bos_taurus  5
002、绘图
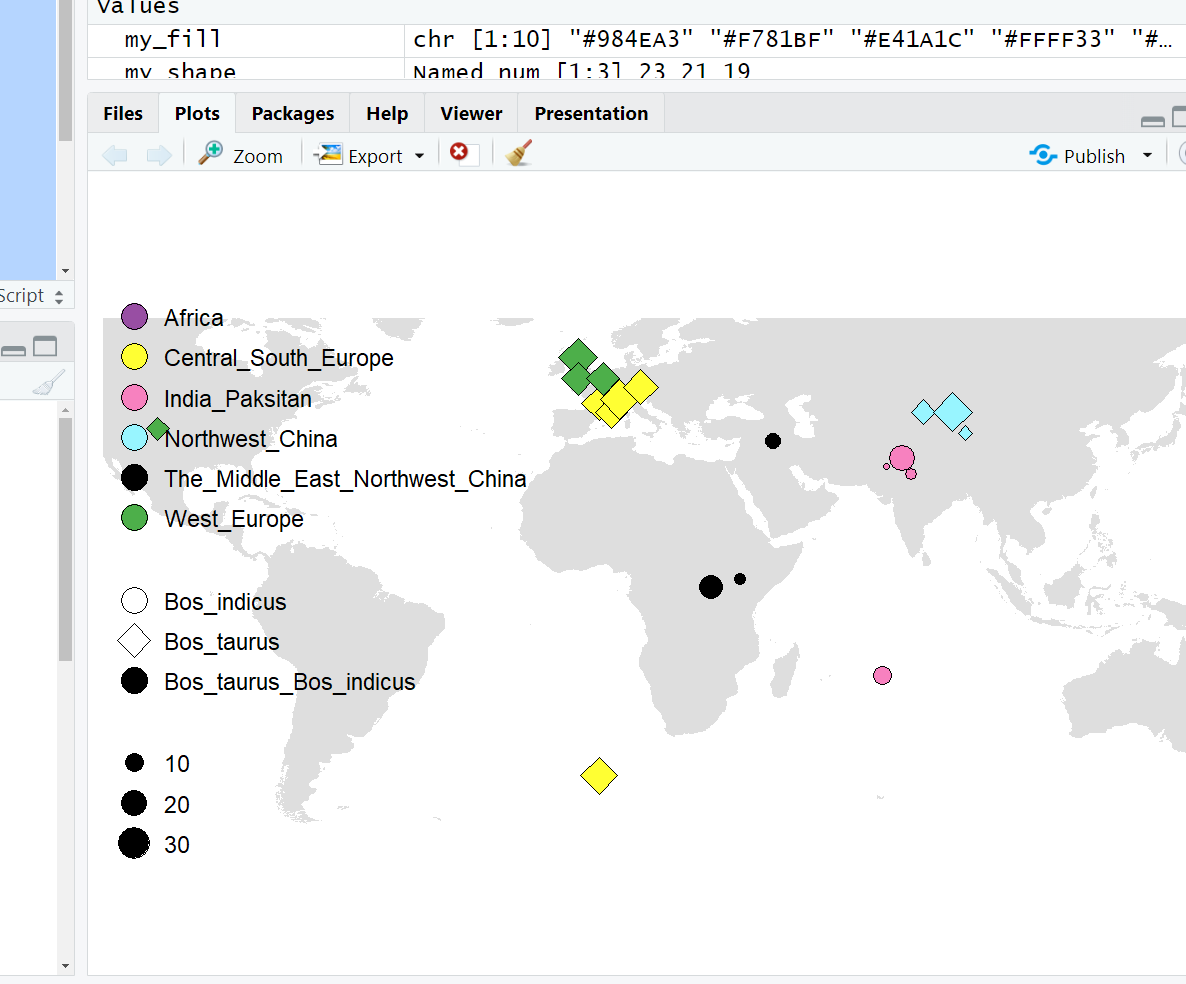
library(ggplot2)
library(ggthemes)

mymap <- read.table("distri.txt", header =T)
head(mymap)

world <- map_data("world")

my_fill = c("Africa"="#984EA3","India_Paksitan"="#F781BF","South_China"="#E41A1C",
            "Central_South_Europe"="#FFFF33","Northeast_Asia"="#FF7F00",
            "Northwest_China"="#98F5FF","Tibet"="#377EB8","West_Europe"="#4DAF4A",
            "North_Central_China"="#000000","The_Middle_East_Northwest_China"="#000000")
my_shape = c("Bos_taurus"=23,"Bos_indicus"=21,"Bos_taurus_Bos_indicus"=19)


p1 <- ggplot(world, aes(long, lat)) +
  geom_map(map=world, aes(map_id=region), fill="#DEDEDE", color=NA) +
  xlim(-105, 135)+ ylim(-50, 60)+
  coord_quickmap()

p2 <- p1 + geom_point(data=mymap, color='black',
                      aes(x = Longitude, y = Latitude,
                          size=num, shape=subspe, fill=diqu))+
  scale_fill_manual(values = my_fill)+
  scale_shape_manual(values = my_shape)+
  theme_map()+
  theme(legend.position=c(0,-0.1),legend.justification=c(0,0), # 图例位置
        legend.background=element_blank(), # 去除图例背景
        legend.title=element_blank(),  # 去除图例标题
        legend.text = element_text(size=10), # 图例文本大小
        legend.key=element_rect(color=NA, fill=NA))+ # 去除图例形状周围的背景

  # 修改图例形状、大小
  guides(fill=guide_legend(override.aes=list(size=5,shape=21)),
         shape = guide_legend(override.aes = list(size=5, sahpe=my_shape)))

p2
绘图结果如下:
。
origin:
01、https://www.jianshu.com/p/6f0639b98017

 浙公网安备 33010602011771号