R语言中geom_polygon在绘图区域截取任意形状、填色(多边形)
001、

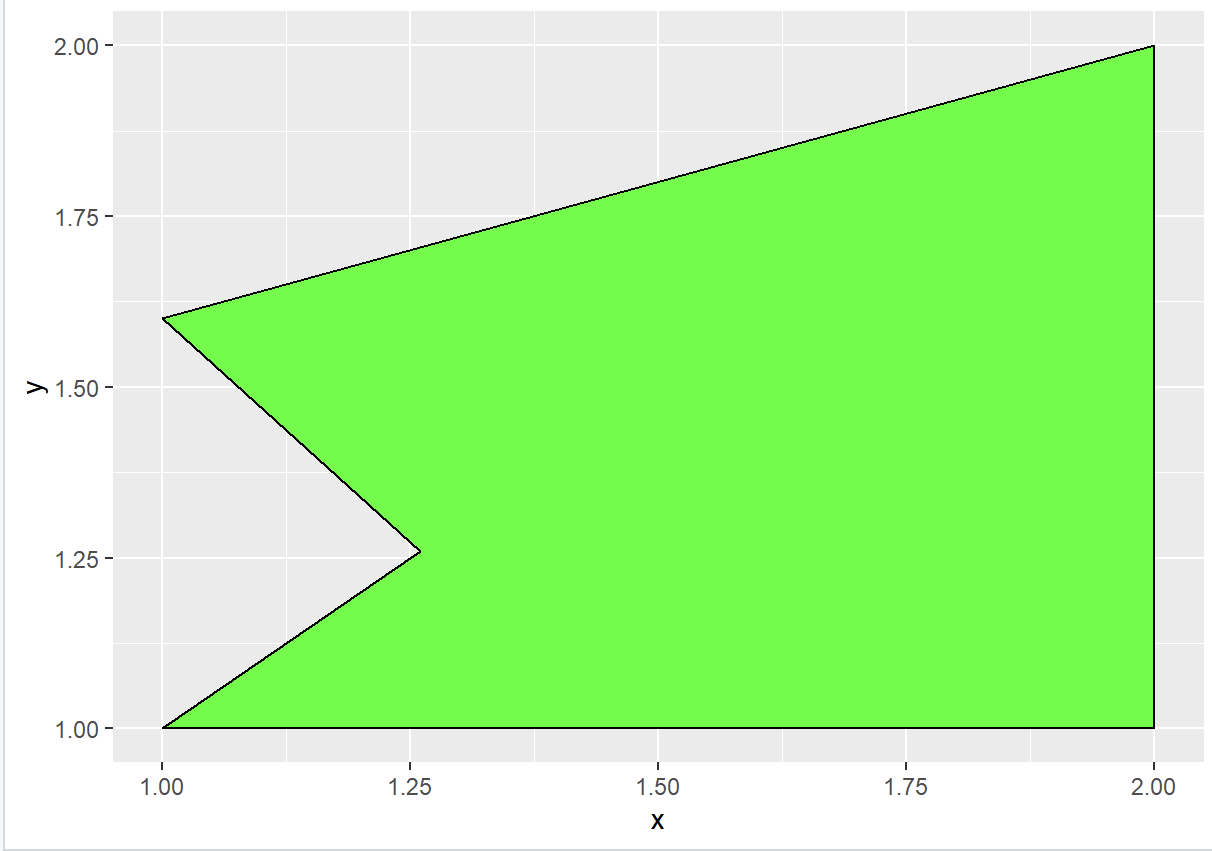
# 创建一个多边形
df <- data.frame(
  x = c(1, 2, 2, 1, 1.26),
  y = c(1, 1, 2, 1.6, 1.26)
)
df
# 绘制多边形
ggplot() +
  geom_polygon(data = df, aes(x = x, y = y),
               fill = "green", colour = "black", alpha)      ## 绘图结果
。

001、
# 创建一个多边形 df <- data.frame( x = c(1, 2, 2, 1, 1.26), y = c(1, 1, 2, 1.6, 1.26) ) df # 绘制多边形 ggplot() + geom_polygon(data = df, aes(x = x, y = y), fill = "green", colour = "black", alpha) ## 绘图结果
。


【推荐】国内首个AI IDE,深度理解中文开发场景,立即下载体验Trae
【推荐】编程新体验,更懂你的AI,立即体验豆包MarsCode编程助手
【推荐】抖音旗下AI助手豆包,你的智能百科全书,全免费不限次数
【推荐】轻量又高性能的 SSH 工具 IShell:AI 加持,快人一步
· 全程不用写代码,我用AI程序员写了一个飞机大战
· DeepSeek 开源周回顾「GitHub 热点速览」
· 记一次.NET内存居高不下排查解决与启示
· 物流快递公司核心技术能力-地址解析分单基础技术分享
· .NET 10首个预览版发布:重大改进与新特性概览!
2023-06-03 linux 中awk命令实现输出匹配字符的上下若干行
2022-06-03 linux正则表达式中\s和\S的作用
2022-06-03 linux中精确匹配如何避免标点符号的影响
2022-06-03 python 列表中利用不连续索引提取列表元素
2021-06-03 c语言 12-1
2021-06-03 c语言 11-10
2021-06-03 c语言 11-8