R语言中plot绘图函数中的参数选项
001、frame.plot = T参数绘图 设置是否显示图边框
par(mfrow = c(1,2))
plot(1:10, cex = 3, pch = 19, frame.plot = T, main = "111")         ## 显示图边框
plot(1:10, cex = 3, pch = 19, frame.plot = F, main = "222")         ## 不显示图边框

。
002、type设置散点输出类型
par(mfrow = c(3,3))
plot(1:10, cex = 3, pch = 19, type  = "p", main = "ppp")
plot(1:10, cex = 3, pch = 19, type  = 'l', main = "lll")
plot(1:10, cex = 3, pch = 19, type  = 'b', main = "bbb")
plot(1:10, cex = 3, pch = 19, type  = 'c', main = "ccc")
plot(1:10, cex = 3, pch = 19, type  = 'o', main = "ooo")
plot(1:10, cex = 3, pch = 19, type  = 'h', main = "hhh")
plot(1:10, cex = 3, pch = 19, type  = 's', main = "sss")
plot(1:10, cex = 3, pch = 19, type  = 'S', main = "SSS")
plot(1:10, cex = 3, pch = 19, type  = 'n', main = "nnn")

003、bty参数设置框线的类型
par(mfrow = c(3,3))
plot(1:10, cex = 3, pch = 19, bty  = "o", main = "ooo")
plot(1:10, cex = 3, pch = 19, bty  = "n", main = "nnn")
plot(1:10, cex = 3, pch = 19, bty  = "l", main = "lll")
plot(1:10, cex = 3, pch = 19, bty  = "7", main = "777")
plot(1:10, cex = 3, pch = 19, bty  = "c", main = "ccc")
plot(1:10, cex = 3, pch = 19, bty  = "u", main = "uuu")
plot(1:10, cex = 3, pch = 19, bty  = "]", main = "]]]")

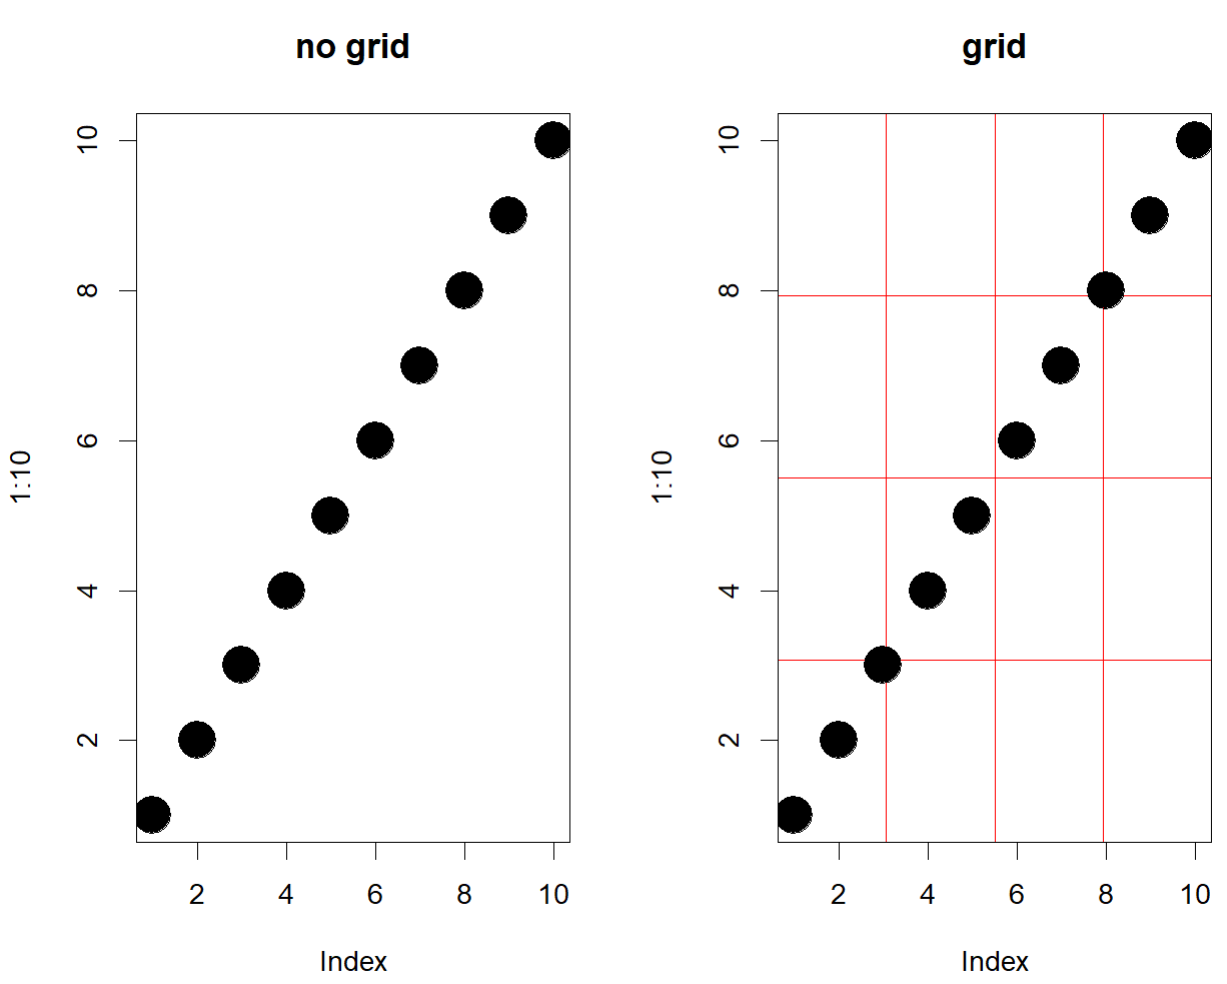
004、 plot绘图函数中增加网格线
par(mfrow = c(1, 2))
plot(1:10, cex = 3, pch = 19, main = "no grid")
plot(1:10, cex = 3, pch = 19, panel.first = grid(4,4, col = "red", lty = 1), main = "grid")

。
005、xaxs参数设置 坐标轴起点
par(mfrow = c(1,2))
# 坐标轴延长
plot(0:10, 0:10, cex = 3, pch = 19, xaxs = 'r',yaxs = 'r', main = "xaxs = 'r'")
plot(0:10, 0:10, cex = 3, pch = 19, xaxs = 'i',yaxs = 'i', main = "xaxs = 'i'")

。
分类:
R语言


【推荐】编程新体验,更懂你的AI,立即体验豆包MarsCode编程助手
【推荐】凌霞软件回馈社区,博客园 & 1Panel & Halo 联合会员上线
【推荐】抖音旗下AI助手豆包,你的智能百科全书,全免费不限次数
【推荐】博客园社区专享云产品让利特惠,阿里云新客6.5折上折
【推荐】轻量又高性能的 SSH 工具 IShell:AI 加持,快人一步
· DeepSeek “源神”启动!「GitHub 热点速览」
· 我与微信审核的“相爱相杀”看个人小程序副业
· 微软正式发布.NET 10 Preview 1:开启下一代开发框架新篇章
· 如何使用 Uni-app 实现视频聊天(源码,支持安卓、iOS)
· C# 集成 DeepSeek 模型实现 AI 私有化(本地部署与 API 调用教程)
2023-06-01 linux 中 删除指定匹配特定字符指定次数之前或者之后的内容
2022-06-01 python 中将列表作为字符串输出
2022-06-01 python 中如何将文本中的所有单词首字母转换为大写,其余为小写
2022-06-01 python中输出文本的指定行
2022-06-01 linux 中输出中位数
2022-06-01 linux 中 awk命令输出连续数值的差
2022-06-01 R语言中实现矩阵和三元组的相互转换