
R语言中ggplot绘图绘制L型图形,并设置框线的粗细
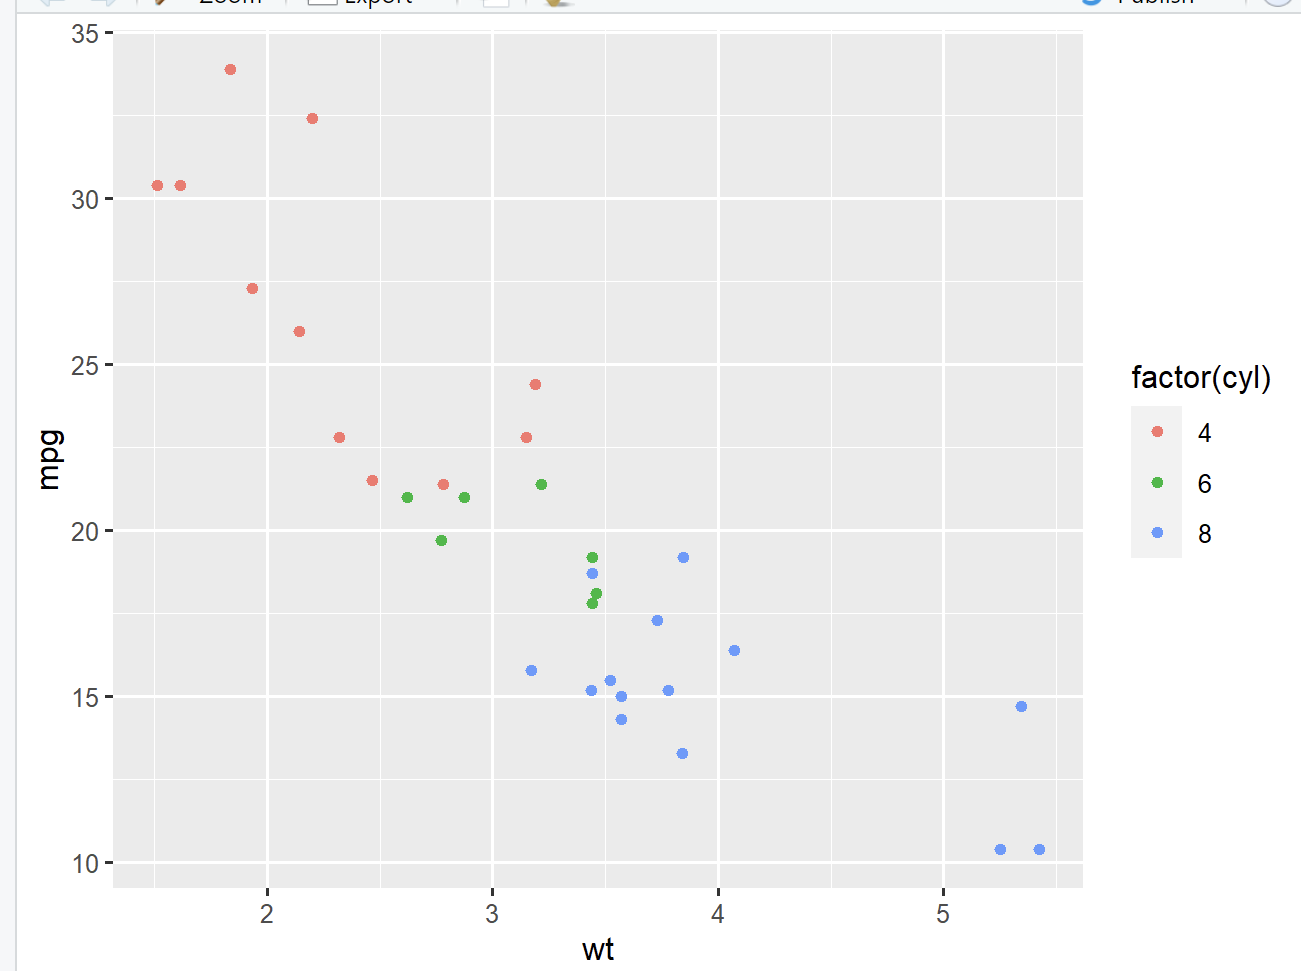
001、基础绘图
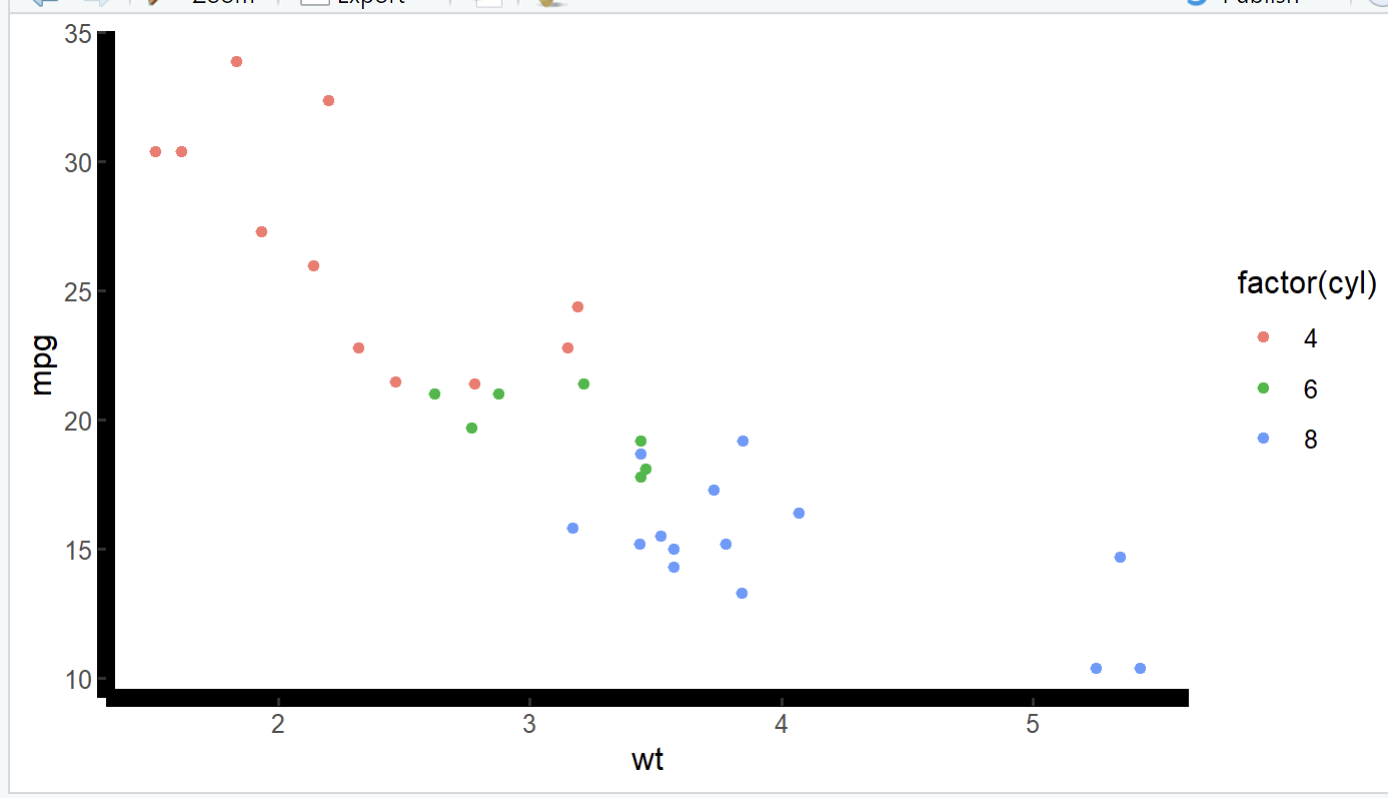
library(ggplot2)            ## 加载包

ggplot(data = mtcars,
       aes(x = wt, y = mpg,
           colour = factor(cyl))) +
  geom_point()              ## 绘制散点图
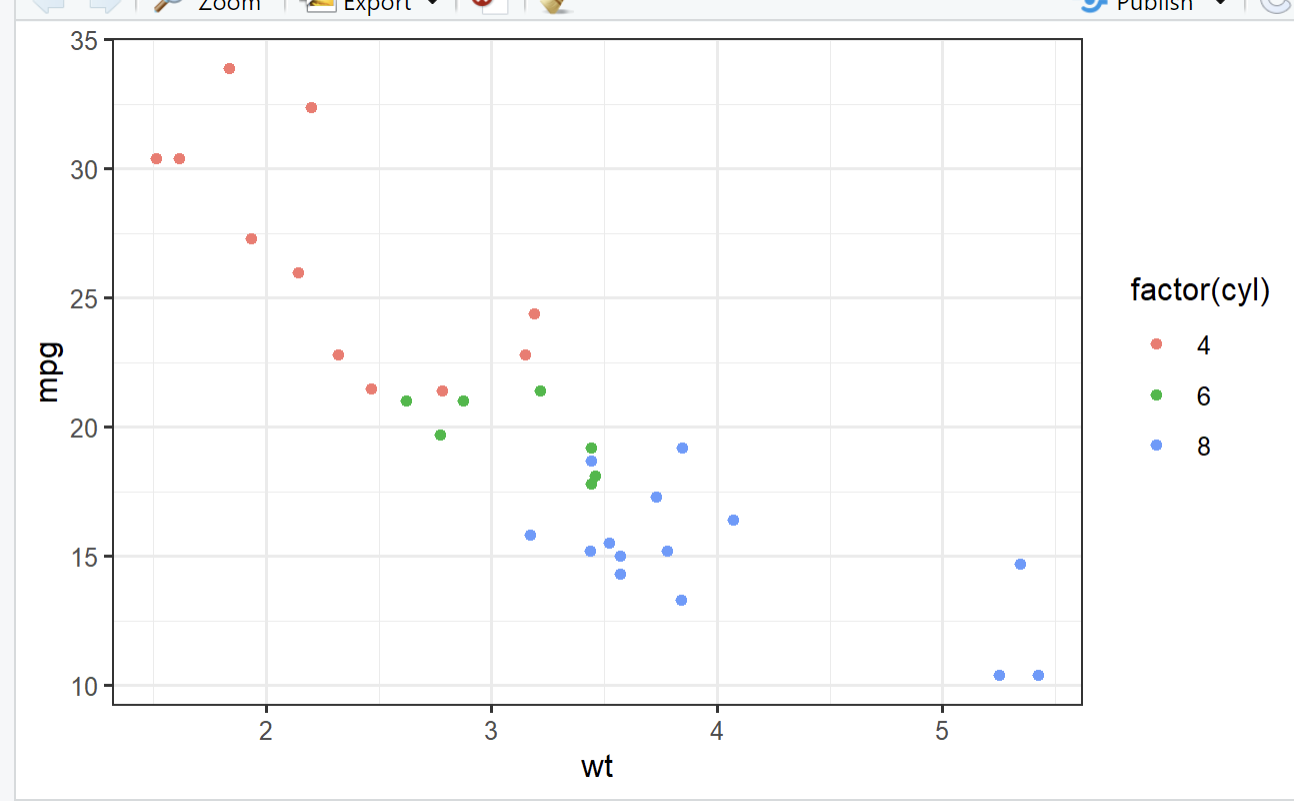
002、增加四边框线

library(ggplot2)#导入ggplot包

ggplot(data = mtcars,
       aes(x = wt, y = mpg,
           colour = factor(cyl))) +
  geom_point() +
  theme_bw()       ## 增加四边框线

#theme_classic()
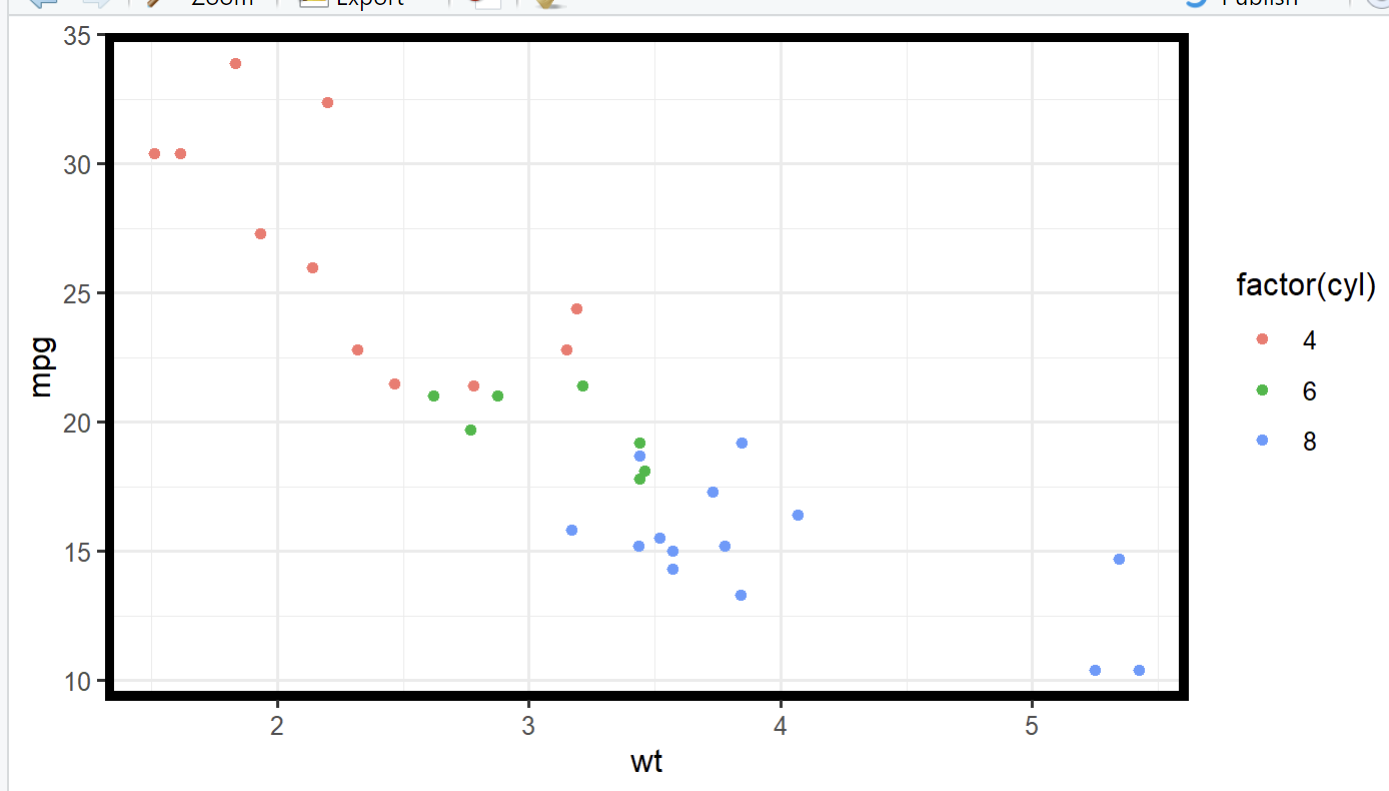
003、调整四边框线的粗细
library(ggplot2)#导入ggplot包

ggplot(data = mtcars,
       aes(x = wt, y = mpg,
           colour = factor(cyl))) +
  geom_point() +
  theme_bw()  +
  theme(panel.border = element_rect(color="black",
  size = 3.0, linetype="solid"))           ## 调整四边框线的粗细
004、改为L型框线
library(ggplot2)#导入ggplot包

ggplot(data = mtcars,
       aes(x = wt, y = mpg,
           colour = factor(cyl))) +
  geom_point() +
theme_classic()            ## 改为L型框线
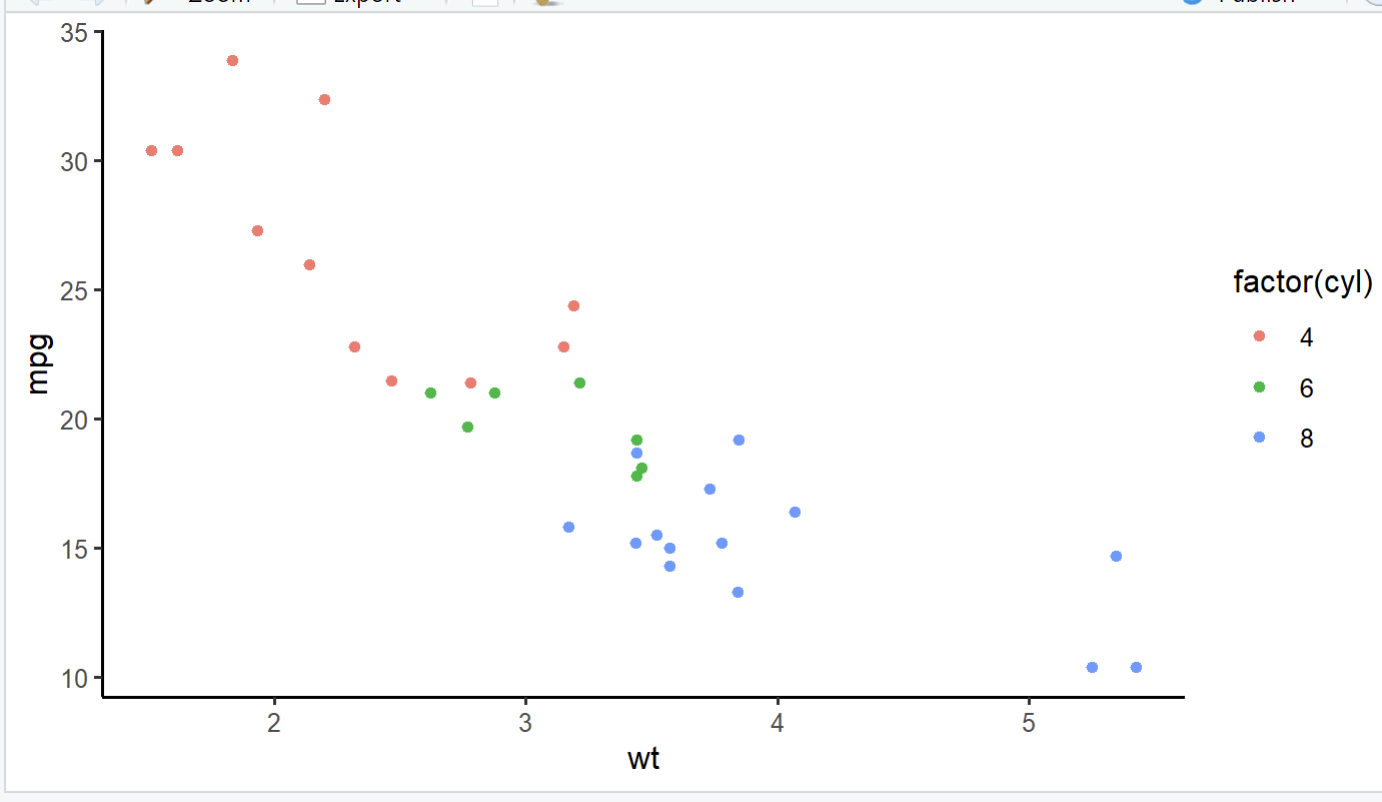
005、调整L型框线的粗细
library(ggplot2)#导入ggplot包

ggplot(data = mtcars,
       aes(x = wt, y = mpg,
           colour = factor(cyl))) +
  geom_point() +
theme_classic() +
theme(axis.line=element_line(color="black",size = 3))     ## 调整L型框线的粗细
。


【推荐】国内首个AI IDE,深度理解中文开发场景,立即下载体验Trae
【推荐】编程新体验,更懂你的AI,立即体验豆包MarsCode编程助手
【推荐】抖音旗下AI助手豆包,你的智能百科全书,全免费不限次数
【推荐】轻量又高性能的 SSH 工具 IShell:AI 加持,快人一步
· 震惊!C++程序真的从main开始吗?99%的程序员都答错了
· 【硬核科普】Trae如何「偷看」你的代码?零基础破解AI编程运行原理
· 单元测试从入门到精通
· 上周热点回顾(3.3-3.9)
· winform 绘制太阳,地球,月球 运作规律
2023-03-08 samtools 统计重测序数据深度 depth、depth -a、depth -aa的联系与区别
2021-03-08 python中如何获取函数文档
2021-03-08 python中写一个求阶乘的函数
2021-03-08 python中写一个求阶乘的函数
2021-03-08 python中map()内置函数
2021-03-08 python中filter关键字
2021-03-08 python中lambda关键字创建匿名函数