
ggplot中绘图修改坐标轴的范围
001、
ggplot(mpg, aes(displ, hwy)) +
  geom_point(aes(color = drv)) +
  coord_cartesian(xlim = c(5, 7), ylim = c(10, 30))     ## 设定x、y轴范围

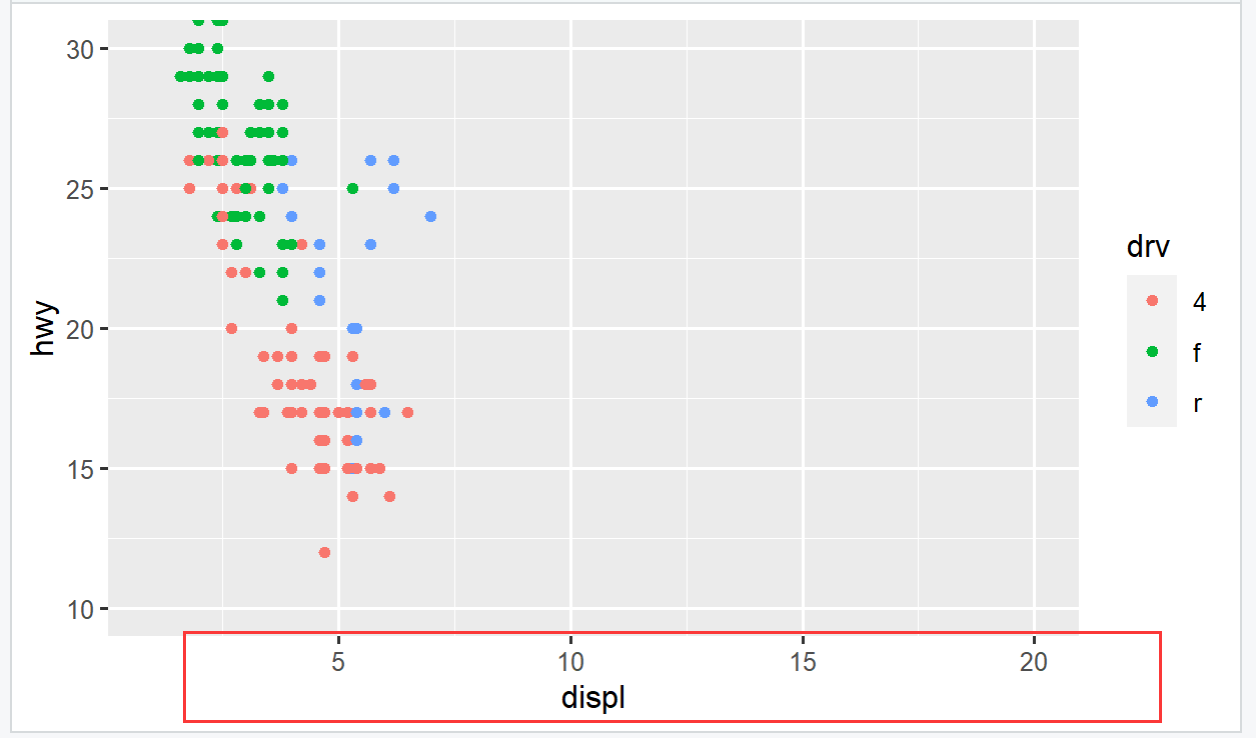
002、 修改x轴范围
ggplot(mpg, aes(displ, hwy)) +
  geom_point(aes(color = drv)) +
  coord_cartesian(xlim = c(1, 20), ylim = c(10, 30))    ## 修改x轴的范围
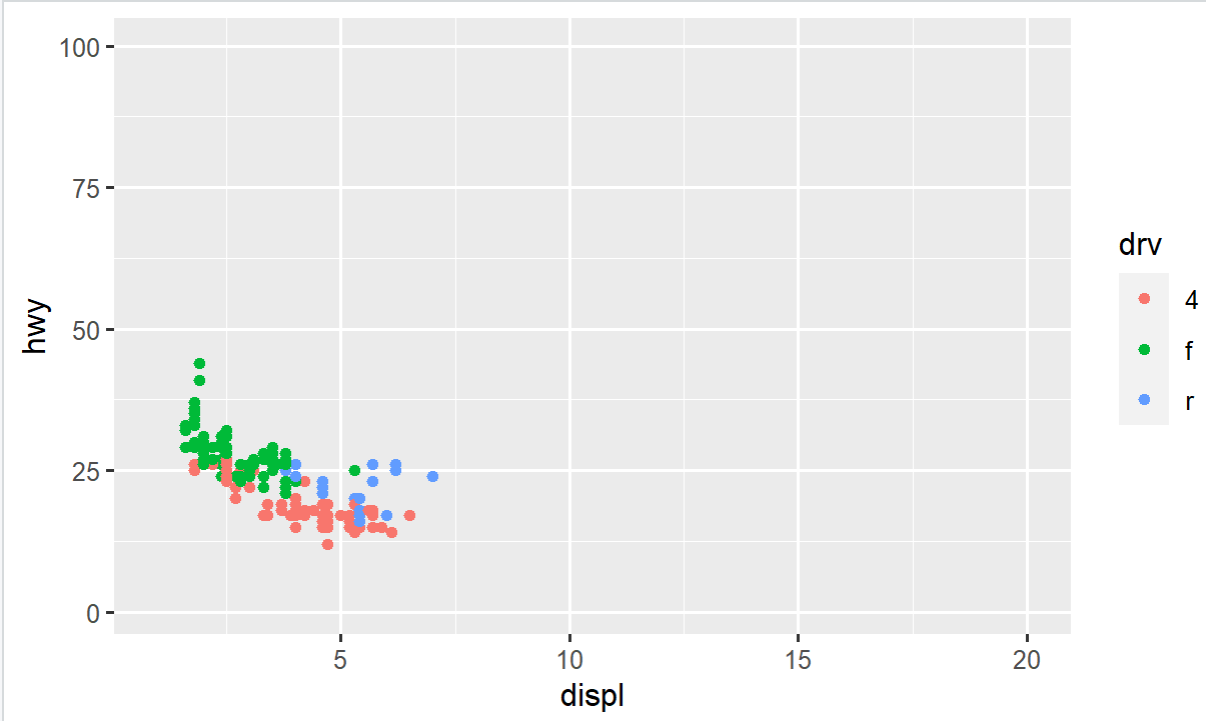
003、修改y轴范围
ggplot(mpg, aes(displ, hwy)) +
  geom_point(aes(color = drv)) +
  coord_cartesian(xlim = c(1, 20), ylim = c(1, 100))        ## 修改y轴范围
。


【推荐】国内首个AI IDE,深度理解中文开发场景,立即下载体验Trae
【推荐】编程新体验,更懂你的AI,立即体验豆包MarsCode编程助手
【推荐】抖音旗下AI助手豆包,你的智能百科全书,全免费不限次数
【推荐】轻量又高性能的 SSH 工具 IShell:AI 加持,快人一步
· 震惊!C++程序真的从main开始吗?99%的程序员都答错了
· 【硬核科普】Trae如何「偷看」你的代码?零基础破解AI编程运行原理
· 单元测试从入门到精通
· 上周热点回顾(3.3-3.9)
· winform 绘制太阳,地球,月球 运作规律
2022-07-25 HDMI、VGA接口
2021-07-25 linux系统中将一列数据转换为若干列数据(列的顺序不变)
2021-07-25 linux系统中将矩形数据转换为一行、一列的形式
2021-07-25 linux系统中实现文本转置。
2021-07-25 linux shell 如何将多列数据变为一行数据