R语言中 ggplot函数中 annotate选项
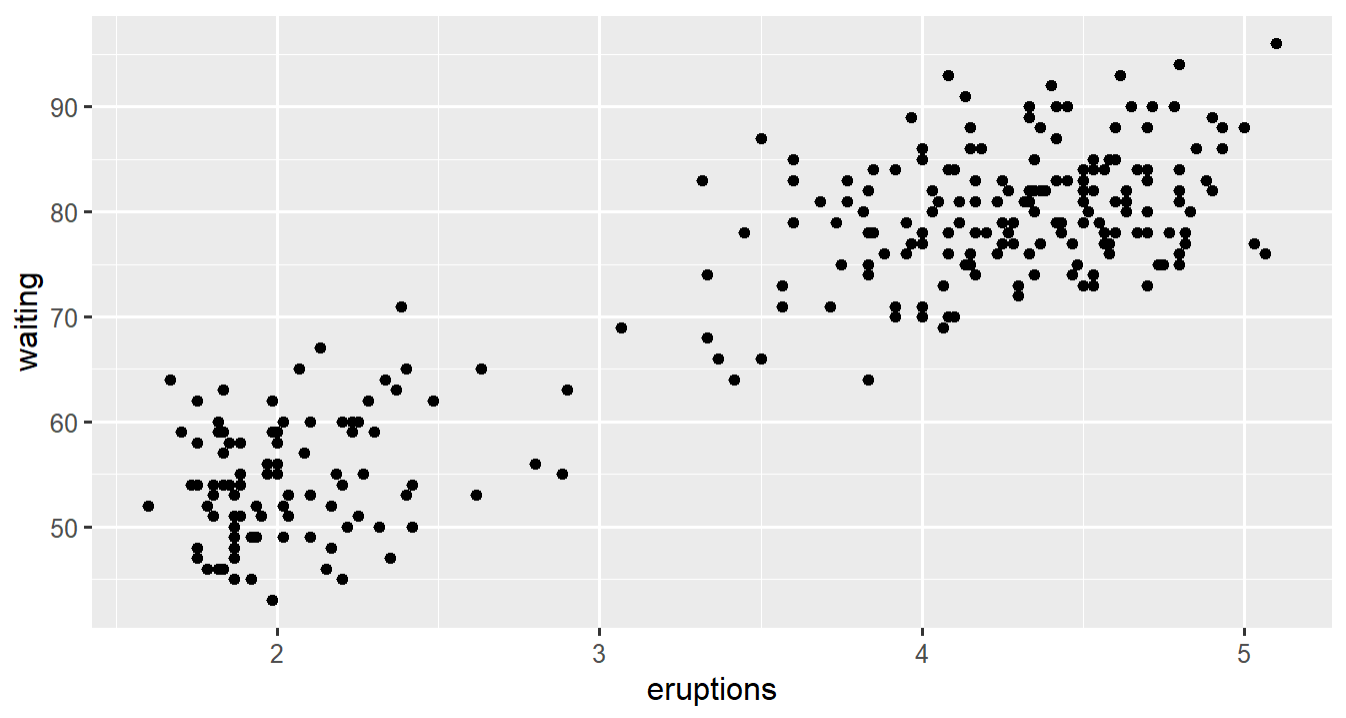
001、基础绘图
library(ggplot2)
p <- ggplot(faithful, aes(x = eruptions, y = waiting)) +
  geom_point()                  ## 基础绘图
p
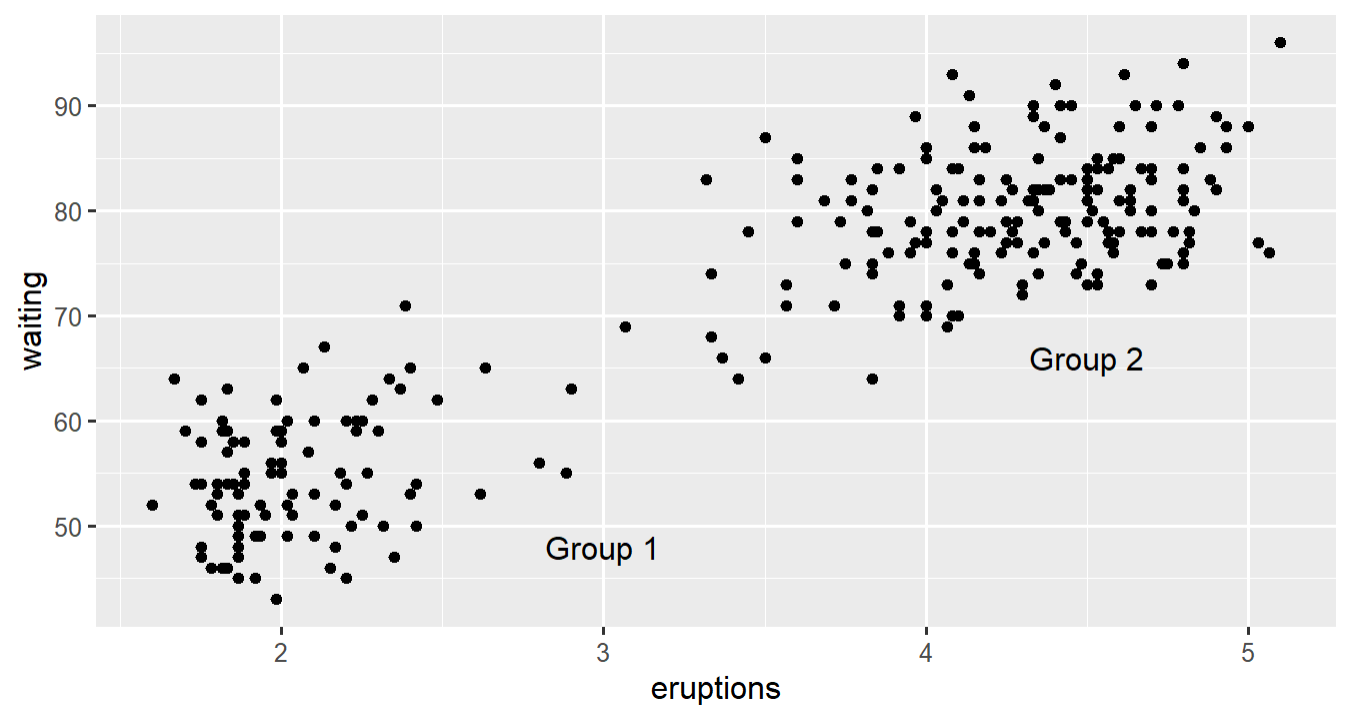
002、增加文本
p + annotate("text", x = 3, y = 48, label = "Group 1") +
annotate("text", x = 4.5, y = 66, label = "Group 2")          ## 增加文本
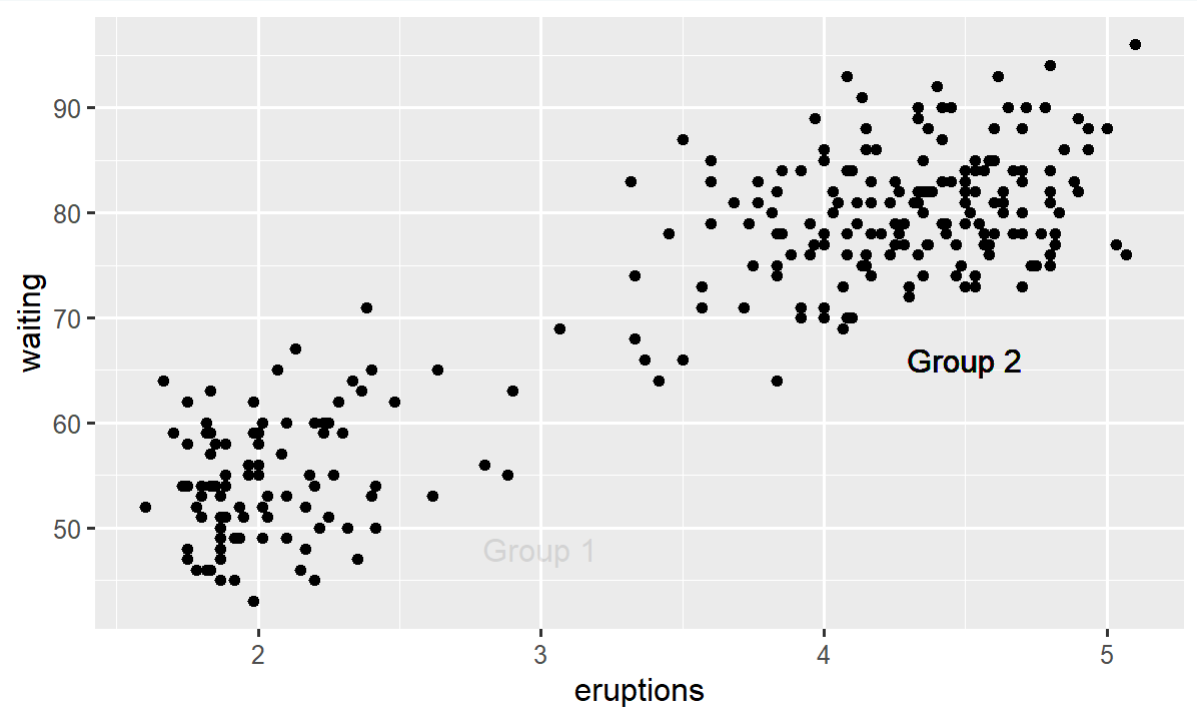
003、 ## 设置颜色、字体、大小等
p + annotate("text", x = 3, y = 48, label = "Group 1",
    family = "serif", fontface = "italic", colour = "darkred",
    size = 5) + annotate("text", x = 4.5, y = 66,
    label = "Group 2", family = "serif", fontface = "italic",
    colour = "darkred", size = 5)            ## 设置颜色、字体、大小等

004、 等价geom_text
p + annotate("text",x=3,y=48,label="Group 1", alpha=.1) +
  geom_text(x=4.5, y=66, label="Group 2", alpha=.1)          ## 等价geom_text
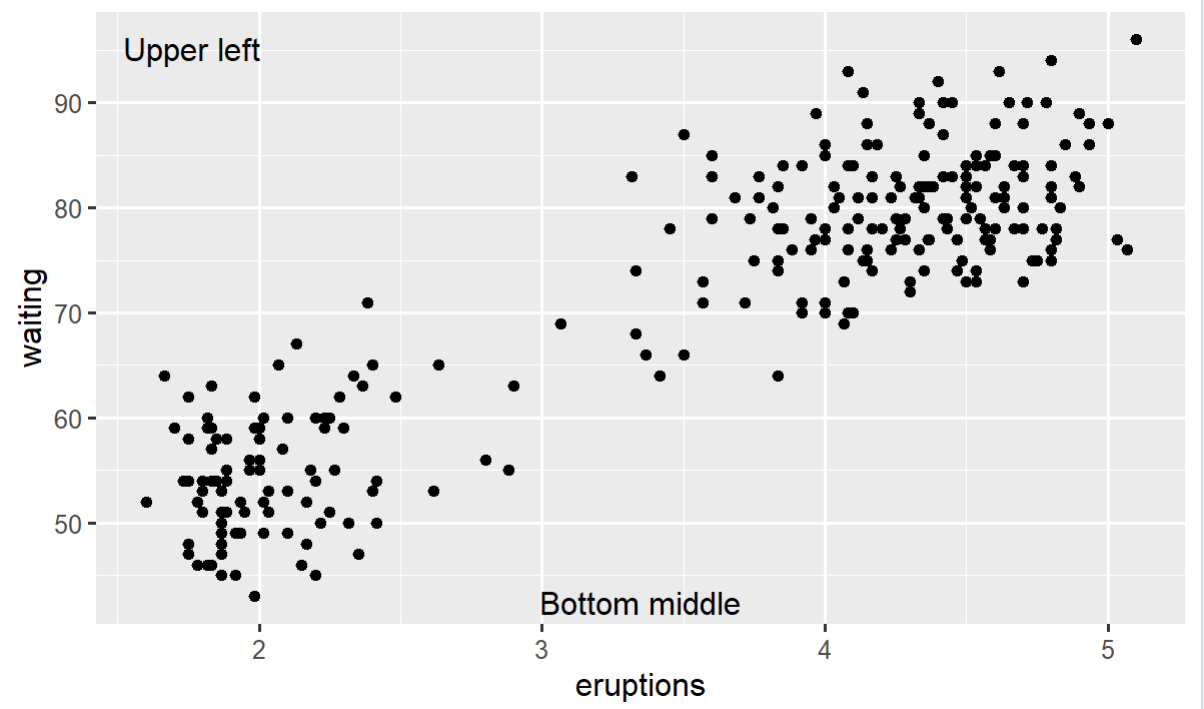
005、指定位置02
p + annotate("text", x = -Inf, y = Inf, label = "Upper left",
             hjust = -0.2,vjust = 2) +
annotate("text", x = mean(range(faithful$eruptions)), y = -Inf,
                      vjust = -0.4, label = "Bottom middle")       ## 指定位置02
。
来源:https://blog.csdn.net/g_r_c/article/details/19673625

 浙公网安备 33010602011771号