
R语言 ggplot函数 中 annotate选项
001、基础绘图
library(ggplot2)
p <- ggplot(data.frame())+geom_point()+xlim(0,10)+ylim(0,10)       ## 基础绘图
p
002、增加文本
an1 <- p + annotate("text", x = 5, y = 5, label = "Some text")      ## 增加文本
an1

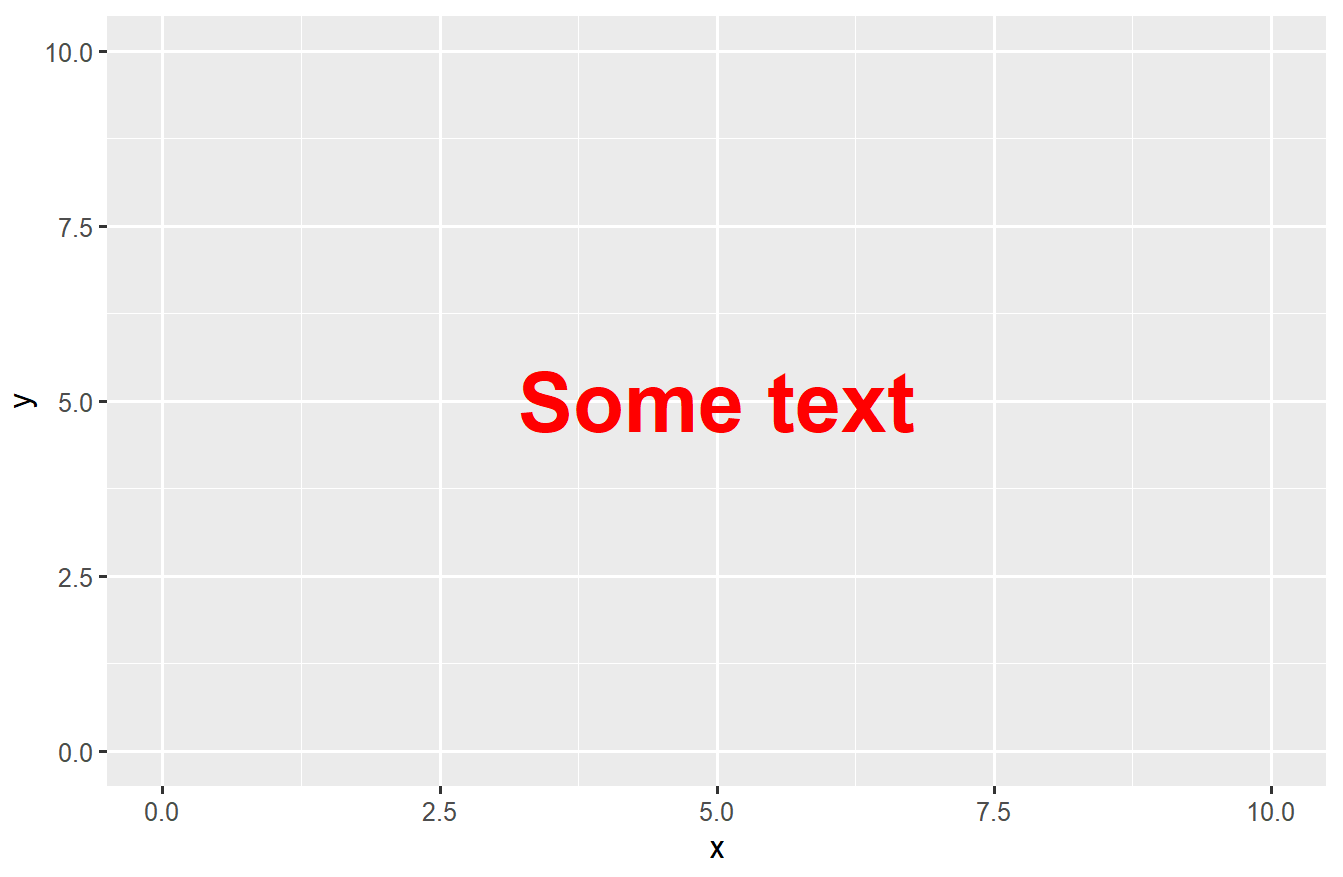
003、修改颜色、字体、大小等;
aaa <- p + annotate("text", x = 5, y = 5, label = "Some text",
                    cex = 10, col = "red", fontface = 2)       ## 修改大小, 颜泽, 字体
aaa
004、同时增加多个图标
an2 <- p + annotate("text", x = 2:5, y = 5, label = "a")     ## 同时增加多个图标
an2

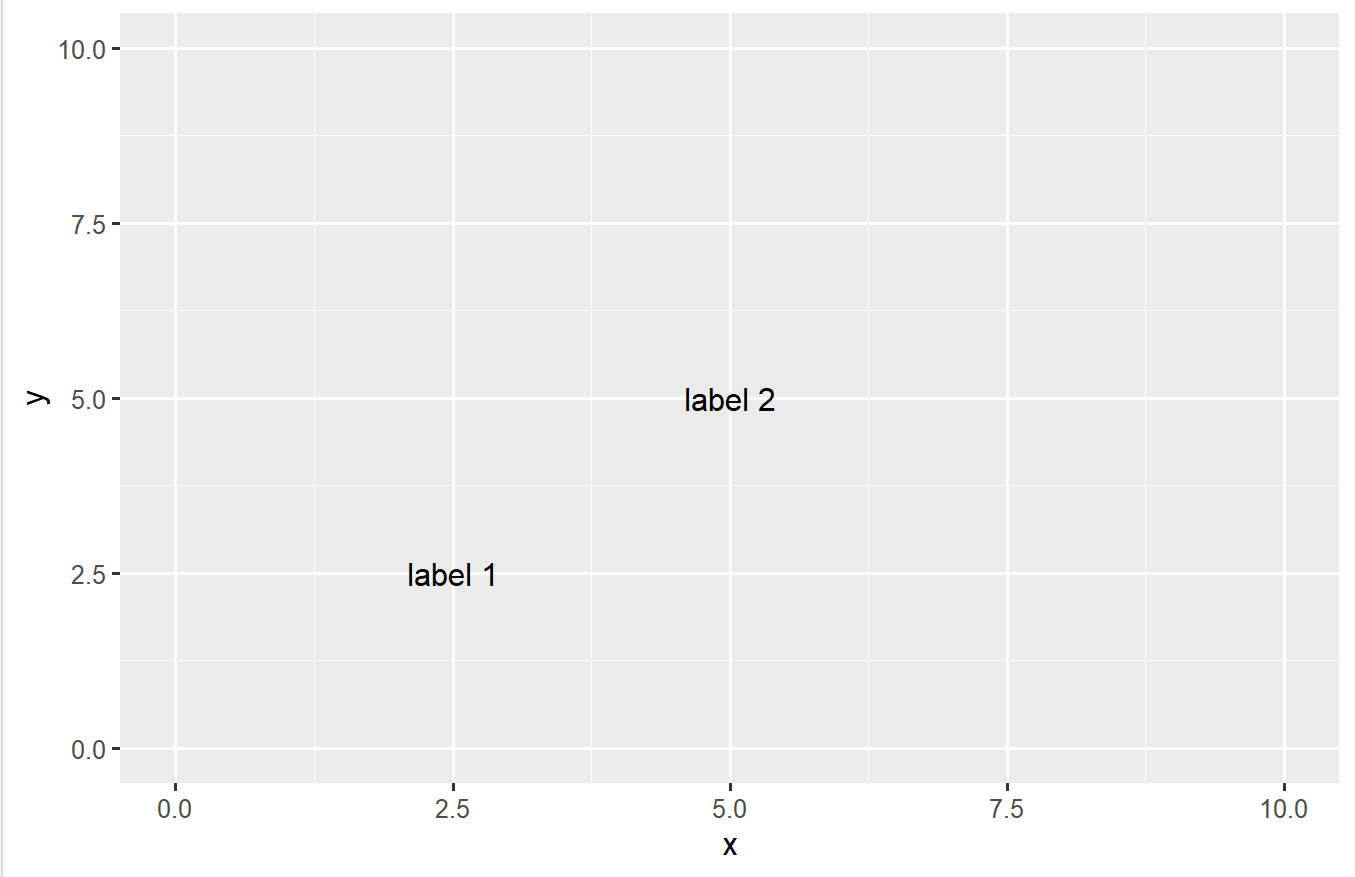
005、同时增加多个图标
an3 <- p + annotate("text", x = c(2.5,5), y = c(2.5,5),
                    label = c("label 1", "label 2"))        ## 同时增加多个图标
an3
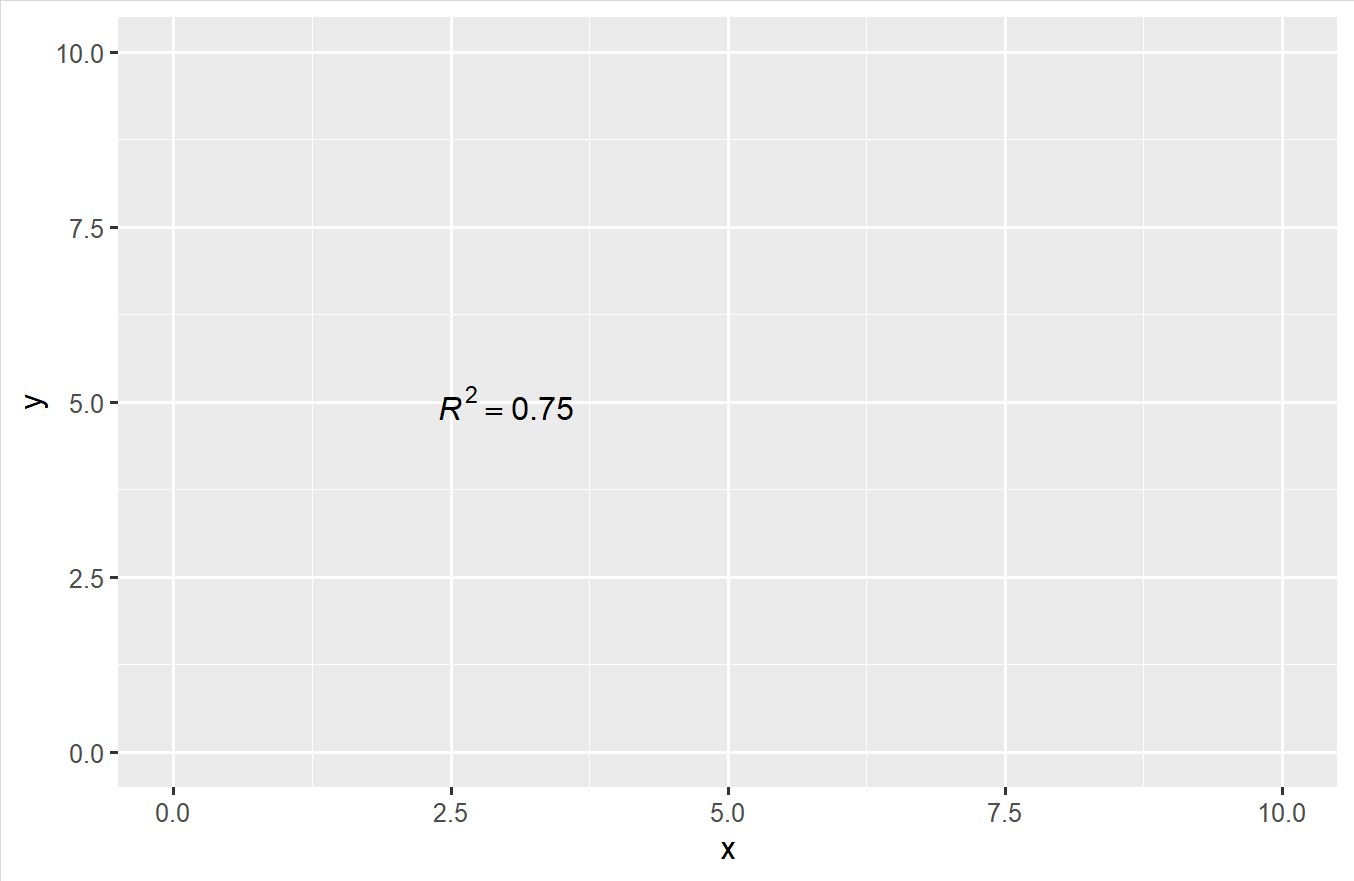
006、增加数学公式
an4 <- p + annotate("text", x = 3, y = 5,
label = "italic(R) ^ 2 == 0.75", parse = TRUE)      ## 增加数学公式
an4
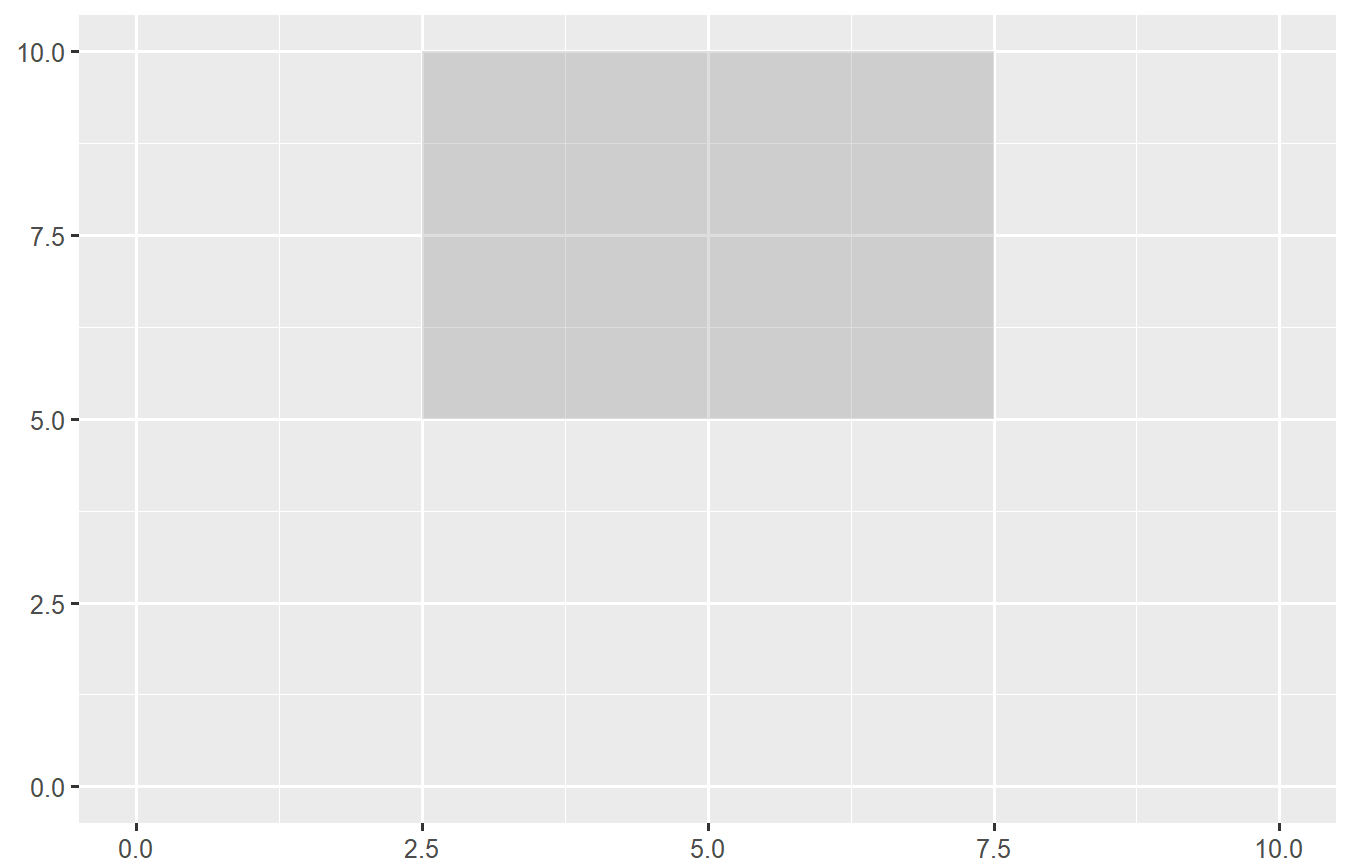
007、增加矩形
an5 <- p + annotate("rect", xmin = 2.5, xmax = 7.5,
      ymin = 5, ymax = 10, alpha = .2)         ## 增加矩形,并设置透明度
an5
008、增加矩形,调整颜色,调整透明度
aa <- p + annotate("rect", xmin = 2.5, xmax = 7.5,        ## 增加矩形,调整颜色, 调整透明度
            fill = "red", col = "red",ymin = 5, ymax = 10, alpha = .4)
aa

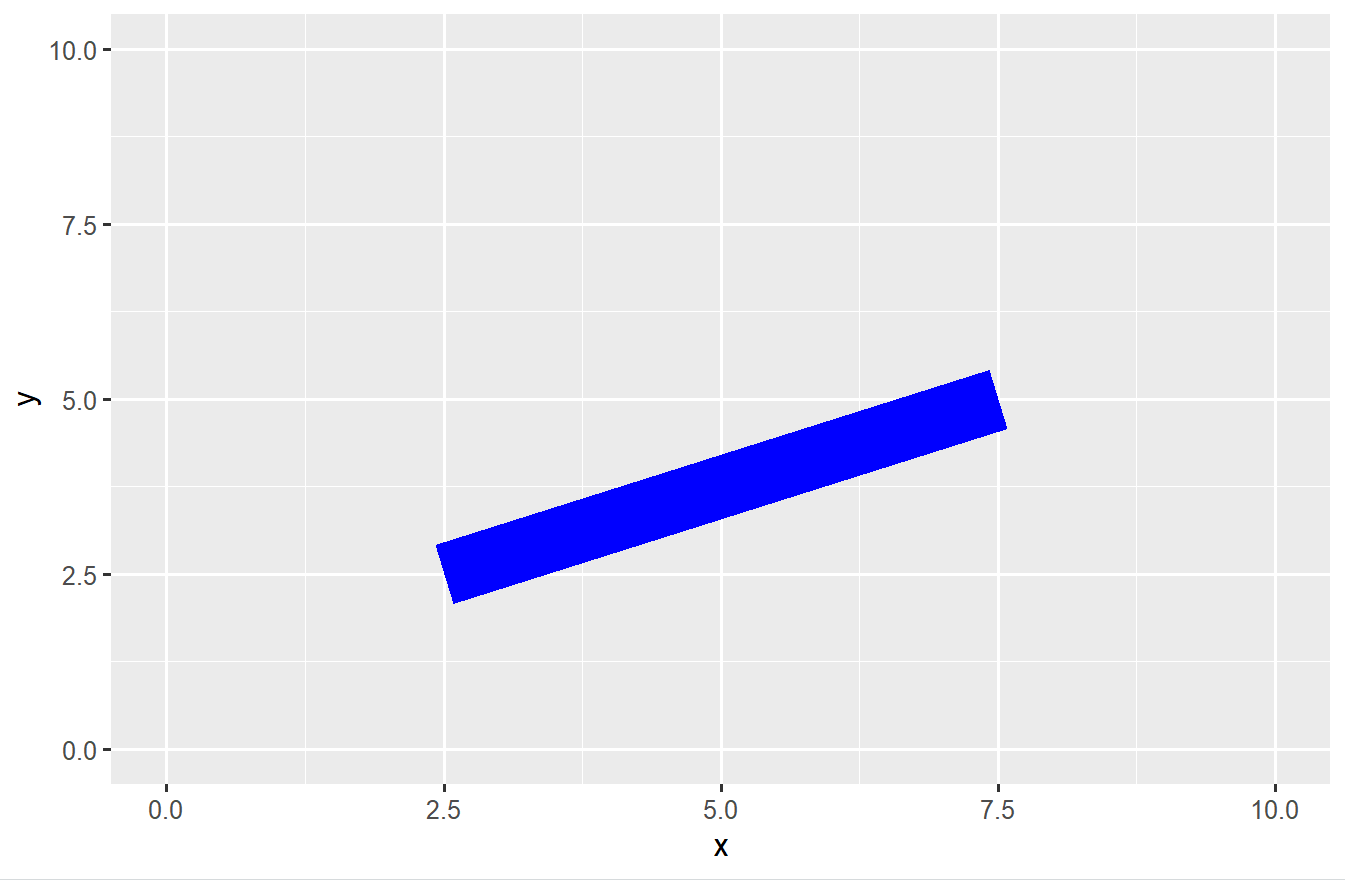
009、增加线段
an6 <- p + annotate("segment", x = 2.5, xend = 7.5, y = 2.5, yend = 5,
                    colour = "blue")      ## 增加线段
an6

010、调整线段的宽度
an6 <- p + annotate("segment", x = 2.5, xend = 7.5, y = 2.5, yend = 5,
                    colour = "blue", lwd = 10)     ## 调整线段的宽度
an6
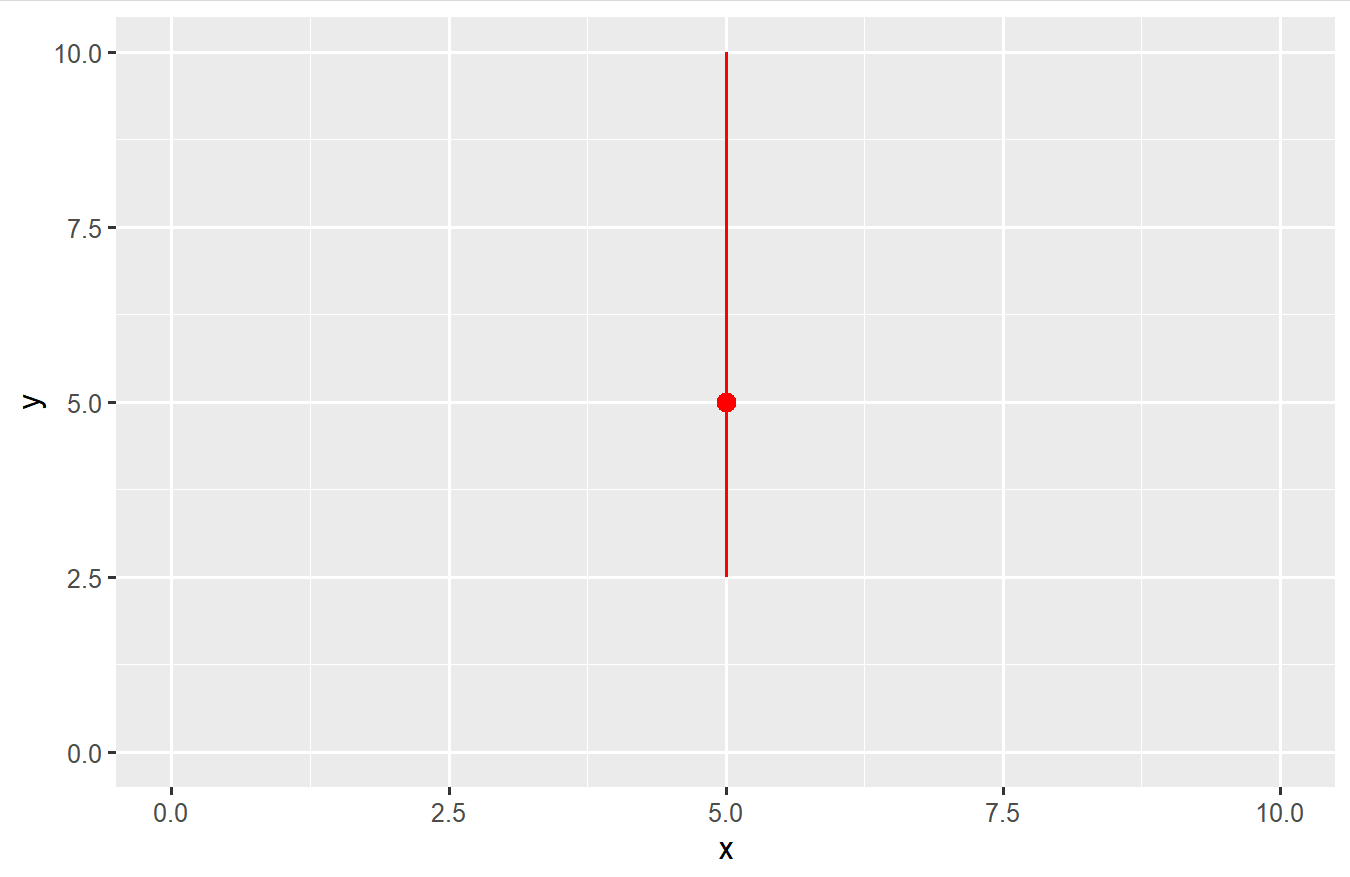
011、增加圆点
an7 <- p + annotate("pointrange",
                    x = 5, y = 5,#红点位置
                    ymin = 2.5, ymax = 10,
                    colour = "red", size = .5)        ## 增加圆点
an7
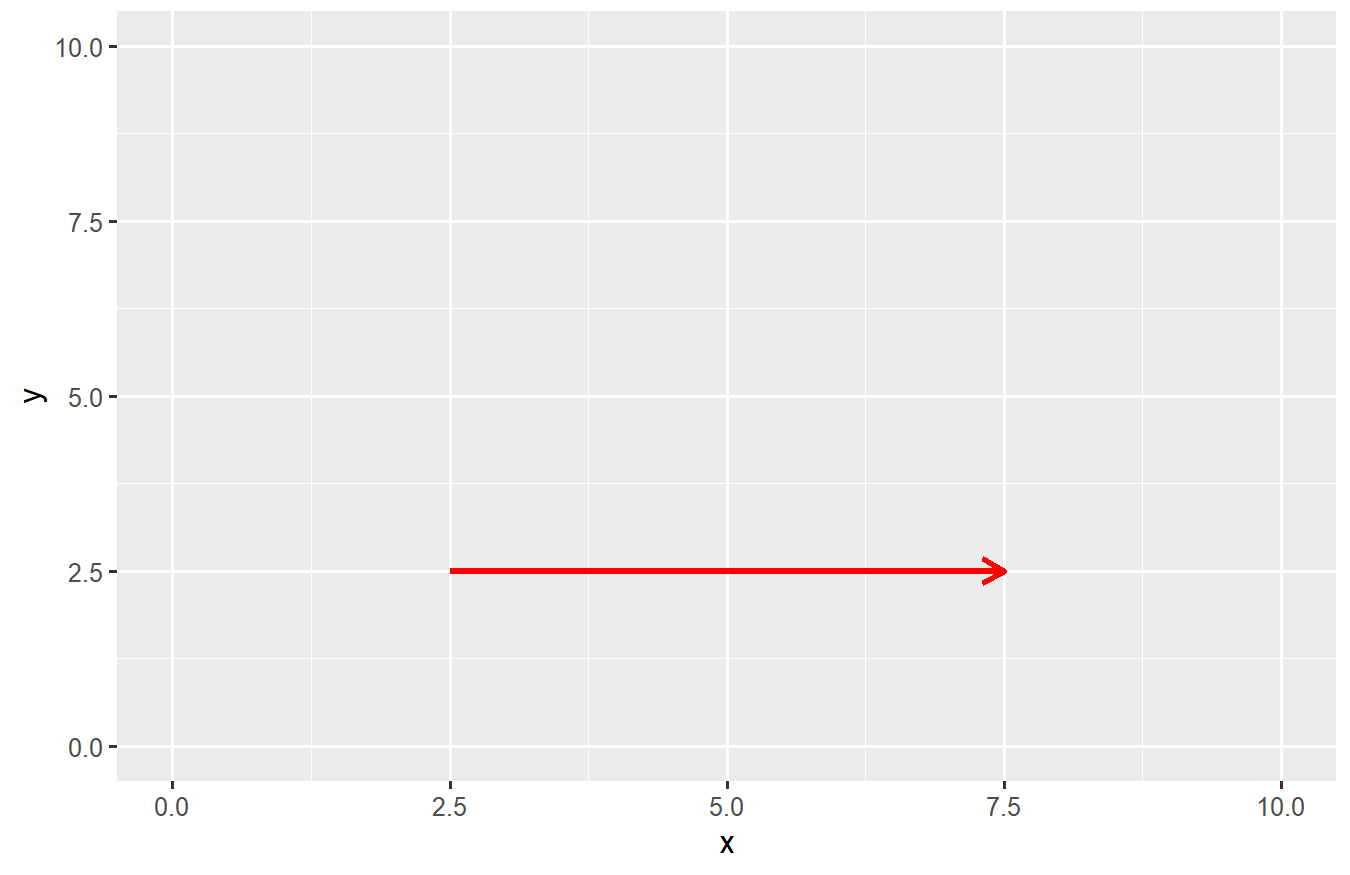
012、增加箭头
an8 <- p + annotate("curve",
          x = 2.5, y = 2.5,xend = 7.5, yend = 2.5,#起始点
          curvature = .5,#弧度  加负号试试
          arrow = arrow(length = unit(3, "mm")))          ## 增加箭头
an8
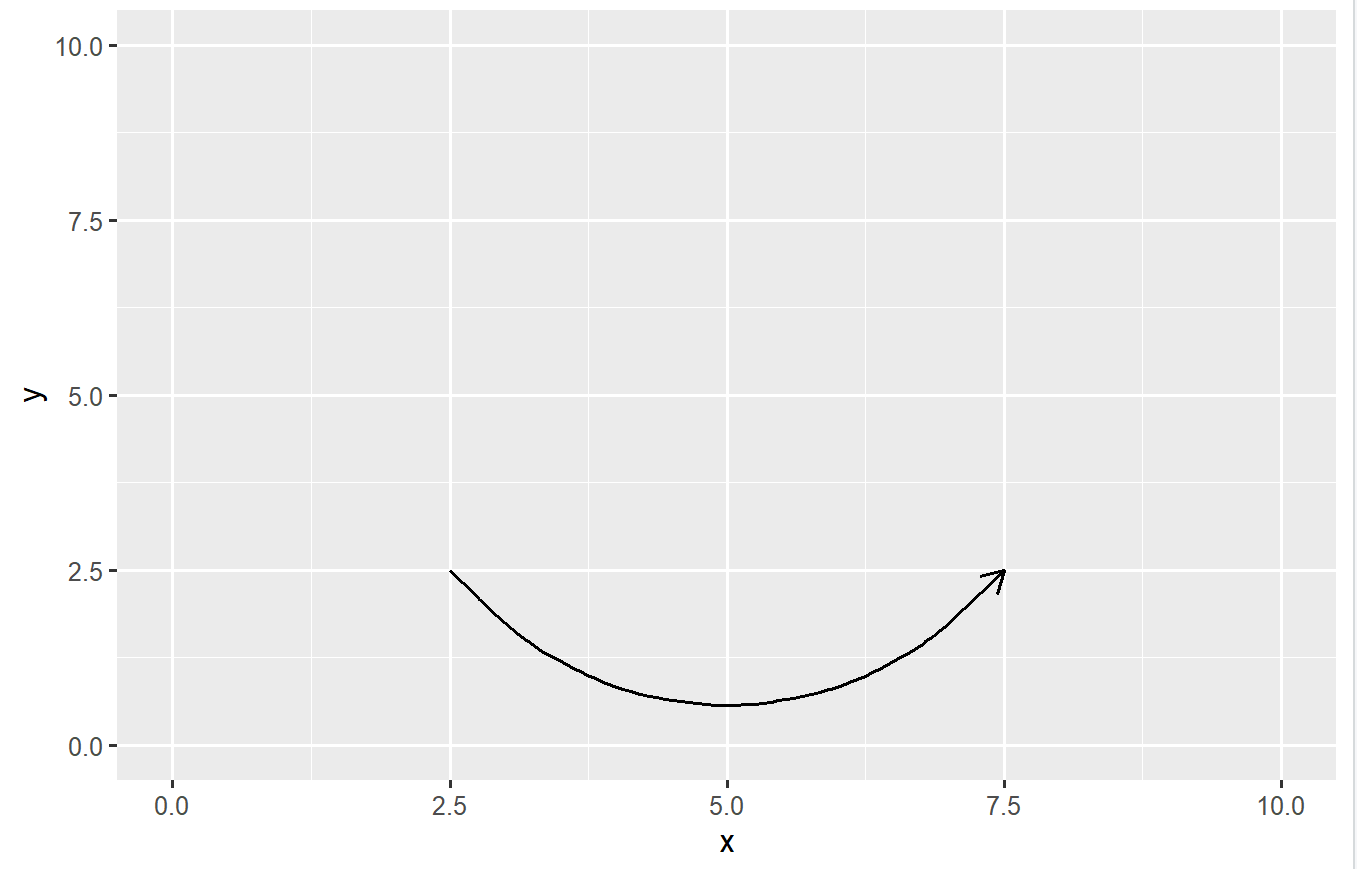
013、增加箭头,调整弧度
an8 <- p + annotate("curve",
          x = 2.5, y = 2.5,xend = 7.5, yend = 2.5,#起始点
          curvature = 0, colour = "red", lwd = 1,       ## 增加箭头, 调整弧度,颜色,宽度
          arrow = arrow(length = unit(3, "mm")))
an8
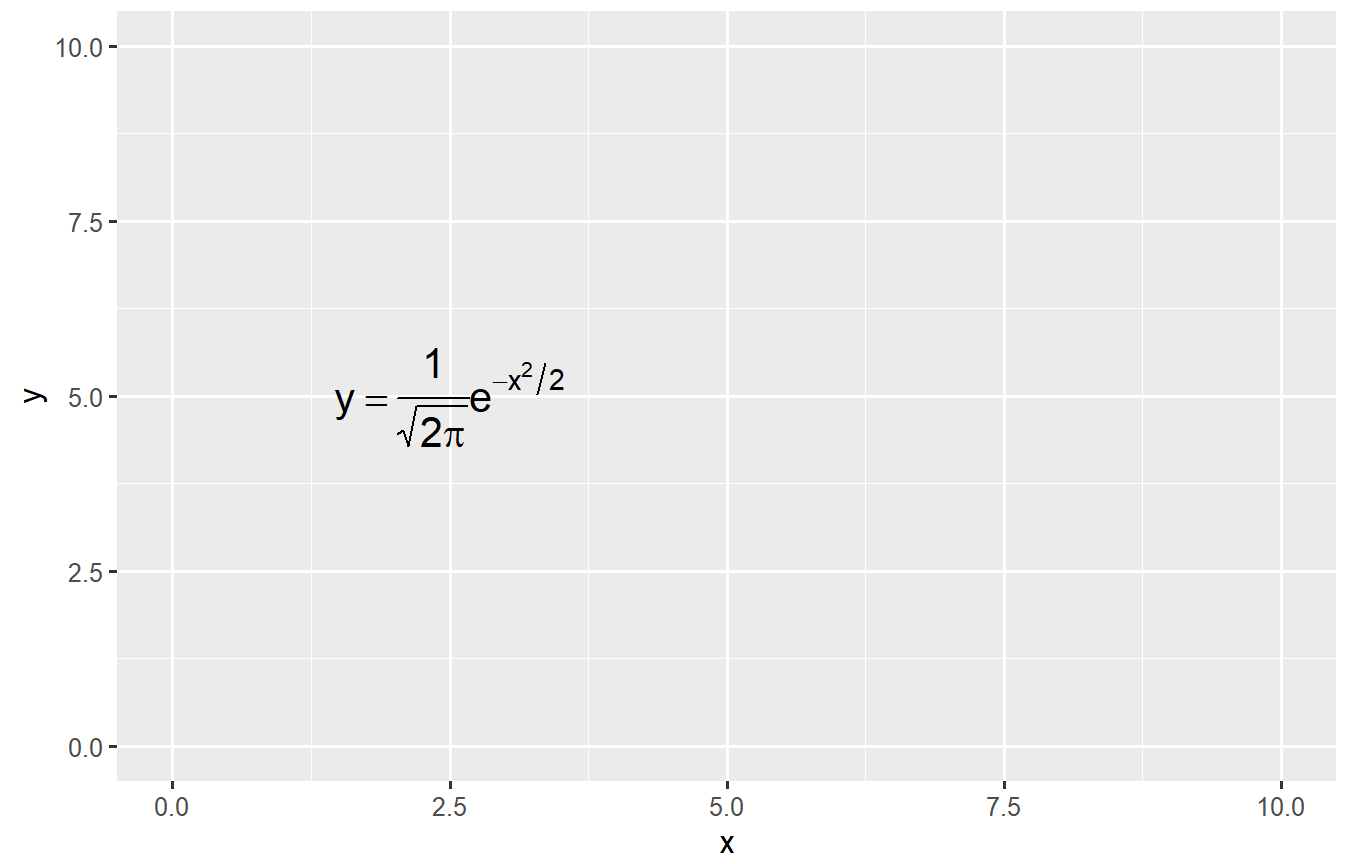
014、公式
p <- ggplot(data.frame())+geom_point()+xlim(0,10)+ylim(0,10)    ## 基础绘图
p
p + annotate("text",x=2.5,y=5,
             parse=TRUE,size=5,
             label="y==frac(1,sqrt(2*pi))*e^{-x^2/2}")         ##  增加公式
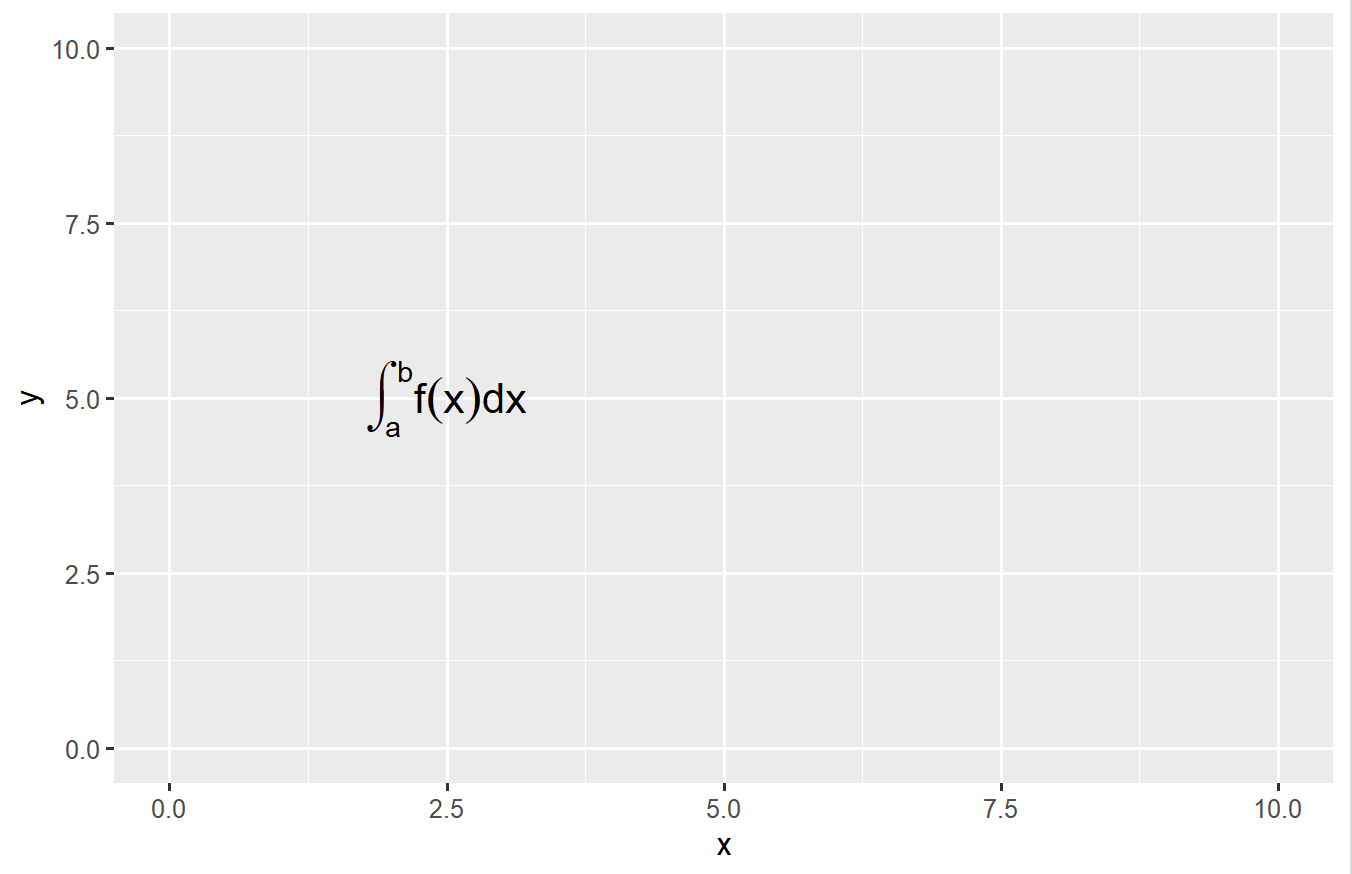
015、公式02
p + annotate("text",x=2.5,y=5,
             parse=TRUE,size=5,
             label="integral(f(x)*dx,a,b)")
。
来源 :https://blog.csdn.net/weixin_55798278/article/details/128807891


【推荐】国内首个AI IDE,深度理解中文开发场景,立即下载体验Trae
【推荐】编程新体验,更懂你的AI,立即体验豆包MarsCode编程助手
【推荐】抖音旗下AI助手豆包,你的智能百科全书,全免费不限次数
【推荐】轻量又高性能的 SSH 工具 IShell:AI 加持,快人一步
· 震惊!C++程序真的从main开始吗?99%的程序员都答错了
· 【硬核科普】Trae如何「偷看」你的代码?零基础破解AI编程运行原理
· 单元测试从入门到精通
· 上周热点回顾(3.3-3.9)
· winform 绘制太阳,地球,月球 运作规律
2022-07-10 使用plink、gemma软件进行gwas分析增加协变量
2022-07-10 主板EATX、ATX、MATX、ITX
2022-07-10 gemma、plink使用一般线性模型进行GWAS分析
2021-07-10 判断系列向量组的线性相关性a1=(1,1,2,0),a2=(1,2,3,-1), a3=(-1,1,0,-2)
2021-07-10 linux系统中tee命令
2021-07-10 若向量组A可由向量组B线性表示,则R(A) <= R(B)