
R语言 ggplot函数中 annotate选项增加注释
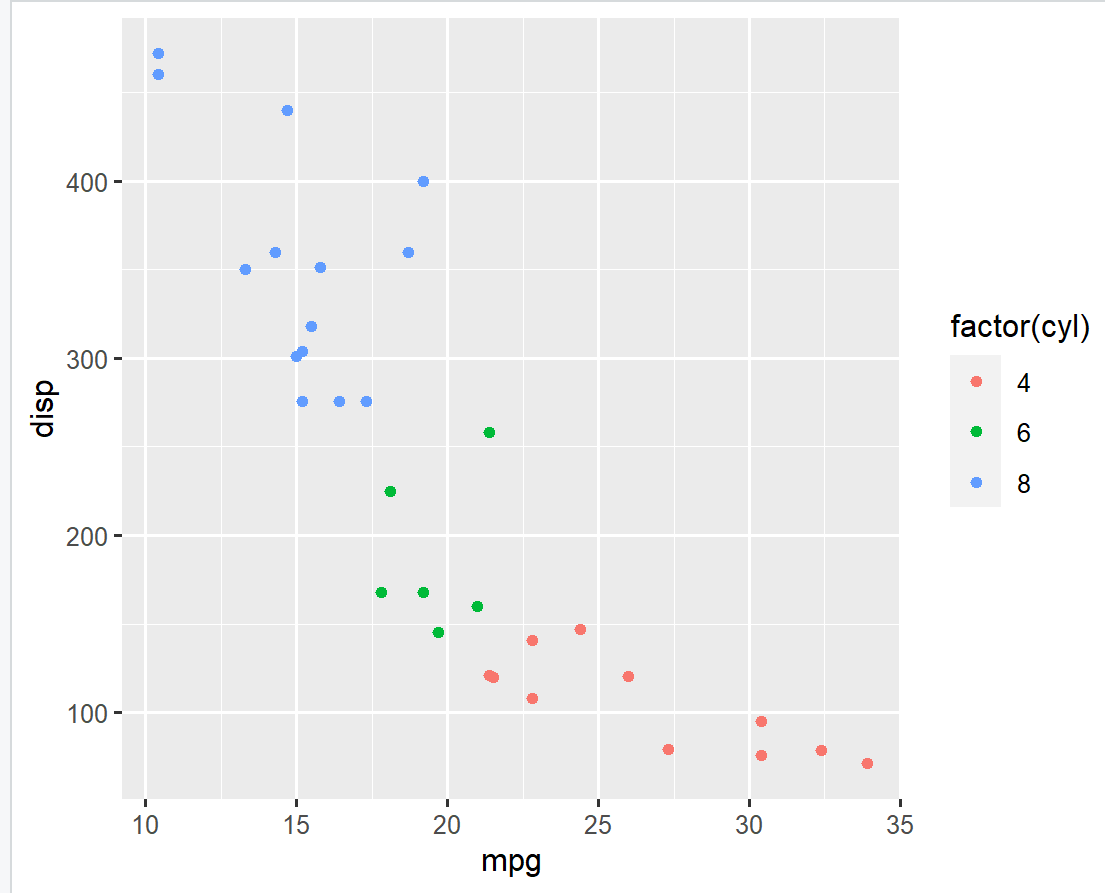
001、基础绘图
ggplot(data=mtcars, aes(x=mpg, y=disp,
  color=factor(cyl))) + geom_point()            ## 基础绘图
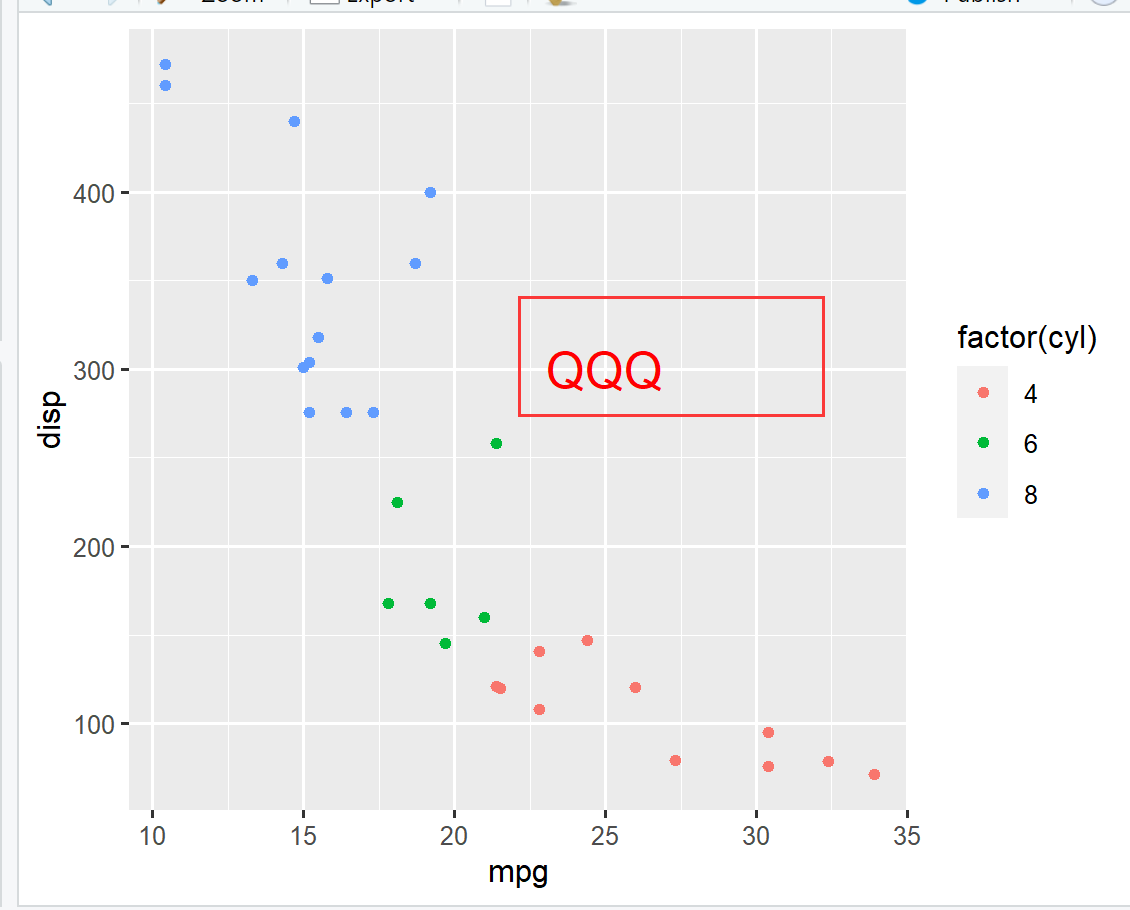
002、annotete在任意位置增加注释
ggplot(data=mtcars, aes(x=mpg, y=disp,      ## 在坐标, 25, 300处增加QQ
  color=factor(cyl))) + geom_point() +
annotate("text", label = "QQQ", x = 25, y = 300, size=6, col = "red")
。


【推荐】国内首个AI IDE,深度理解中文开发场景,立即下载体验Trae
【推荐】编程新体验,更懂你的AI,立即体验豆包MarsCode编程助手
【推荐】抖音旗下AI助手豆包,你的智能百科全书,全免费不限次数
【推荐】轻量又高性能的 SSH 工具 IShell:AI 加持,快人一步
· 震惊!C++程序真的从main开始吗?99%的程序员都答错了
· 【硬核科普】Trae如何「偷看」你的代码?零基础破解AI编程运行原理
· 单元测试从入门到精通
· 上周热点回顾(3.3-3.9)
· winform 绘制太阳,地球,月球 运作规律
2022-07-09 linux 中将科学计数法转换为数值表示(或将数值转换为科学技术法)
2021-07-09 c语言中数据类型基本分类
2021-07-09 linux系统中查看逻辑cpu个数、物理cpu个数、每个cpu的核心数、cpu型号
2021-07-09 linux系统中sed命令删除指定行后的下一行
2021-07-09 linux系统中删除文件的最后几行
2021-07-09 linux系统中sed命令删除指定行及其后的若干行
2021-07-09 linux系统中sed命令整行替换