
R语言中barplot函数绘图实现x轴标签的倾斜显示
001、代码
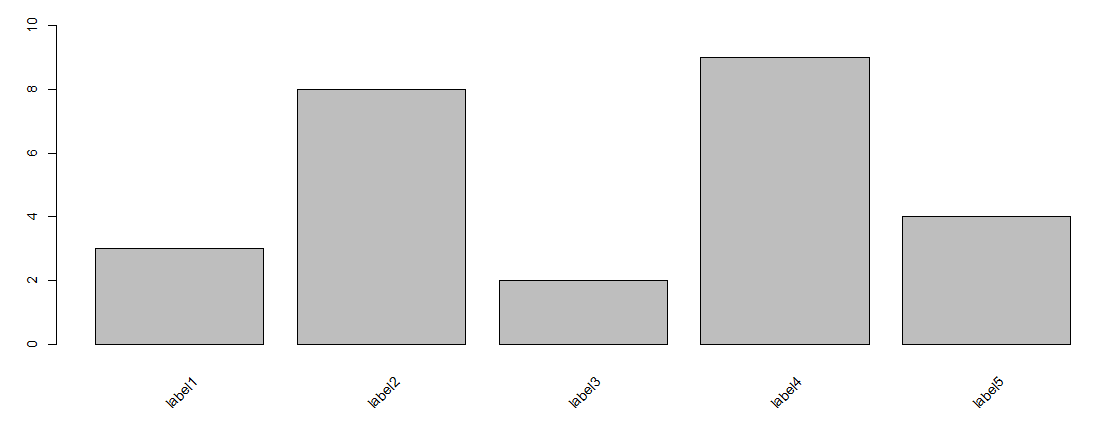
dat <- c(3, 8, 2, 9, 4)
k <- barplot(dat,  axes = FALSE, ylim = c(-4, 10) ,names.arg = FALSE)
axis(2, at = seq(0, 10, 2))
label <- paste0("label", 1:5)
text(x = k, y = -1.5, labels = label, srt = 45)
绘图效果:
参考:http://www.360doc.com/content/17/0912/17/46931810_686548232.shtml


【推荐】国内首个AI IDE,深度理解中文开发场景,立即下载体验Trae
【推荐】编程新体验,更懂你的AI,立即体验豆包MarsCode编程助手
【推荐】抖音旗下AI助手豆包,你的智能百科全书,全免费不限次数
【推荐】轻量又高性能的 SSH 工具 IShell:AI 加持,快人一步
· 震惊!C++程序真的从main开始吗?99%的程序员都答错了
· 【硬核科普】Trae如何「偷看」你的代码?零基础破解AI编程运行原理
· 单元测试从入门到精通
· 上周热点回顾(3.3-3.9)
· winform 绘制太阳,地球,月球 运作规律
2022-05-31 python中实现文本大小写的转换
2022-05-31 python中统计文本的行数及列数
2022-05-31 python 中提取以指定字符开头或指定字符结尾的数据
2022-05-31 python 中从文本中提取包含指定字符的数据
2022-05-31 linux中设置系统时间
2022-05-31 X86、AMD64、X86_64、X64的区别
2022-05-31 redhat9中配置yum仓库