
ggplot2中修改图例的位置
001、默认绘图
bp <- ggplot(PlantGrowth, aes(x=group, y=weight, fill=group)) +
  geom_boxplot()    ## 绘图
bp                  ## 输出图片

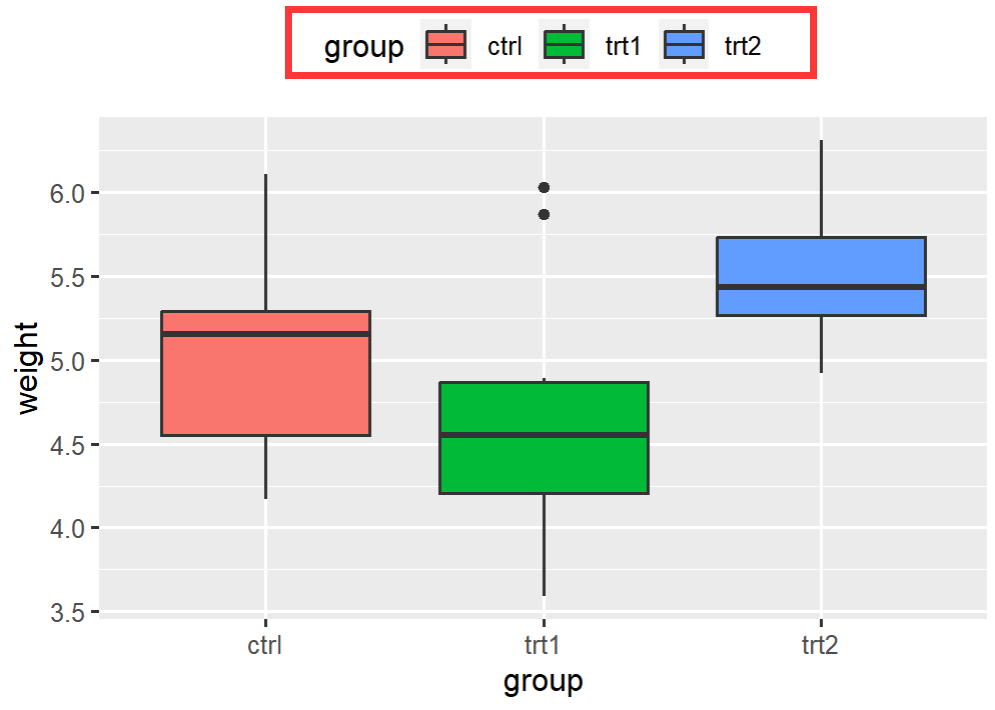
002、上部
bp + theme(legend.position="top") ## 放在上部
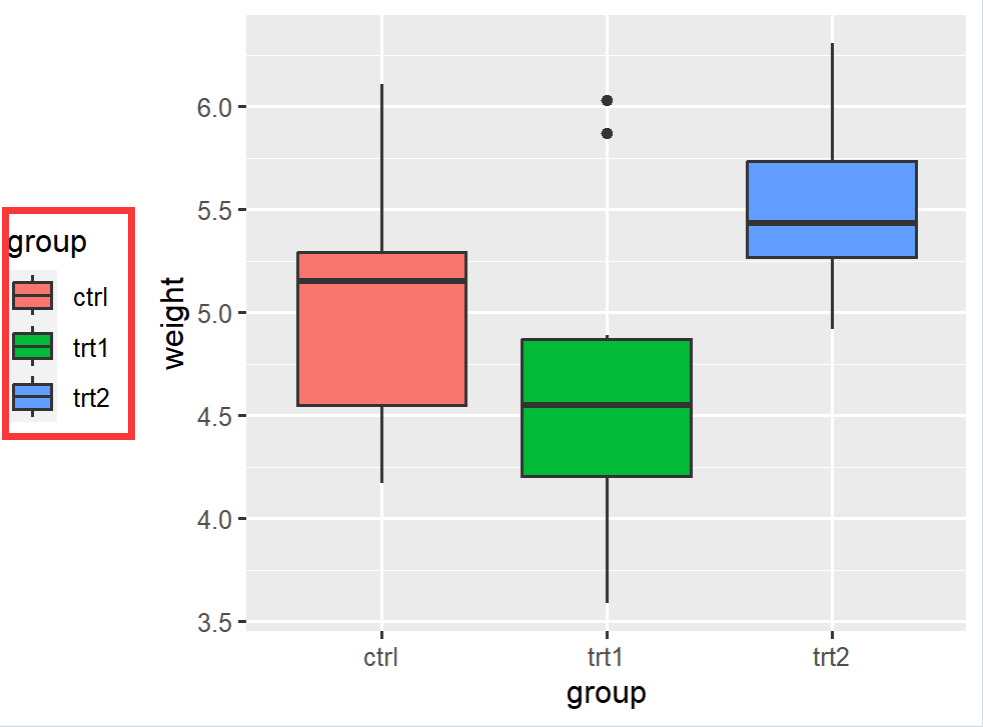
003、左侧
bp + theme(legend.position="left") ## 左侧
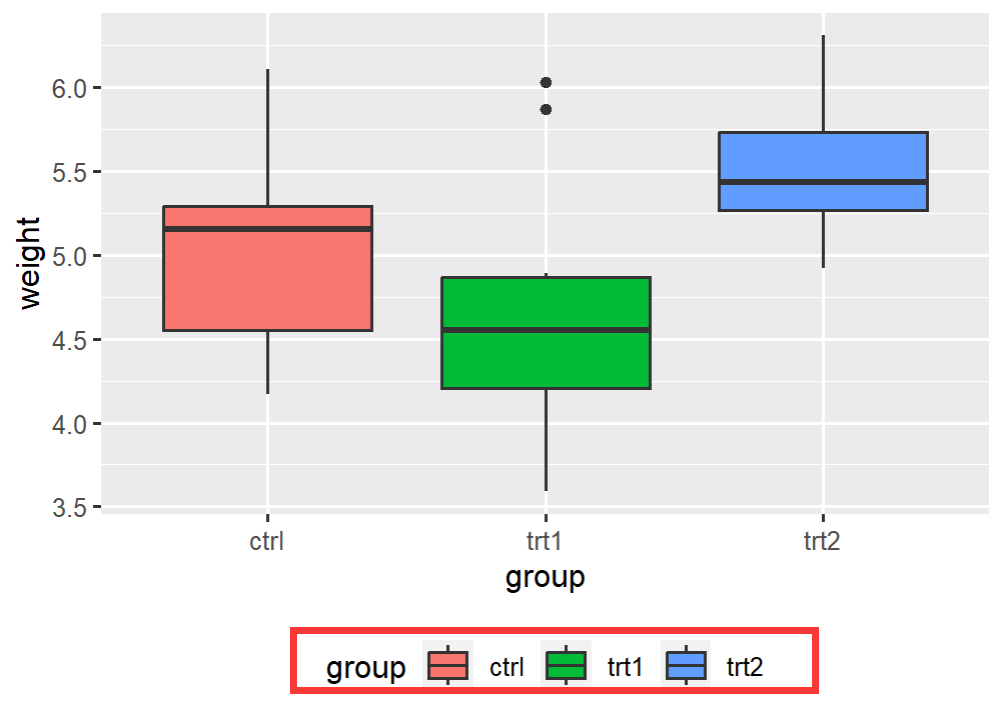
004、下部
bp + theme(legend.position="bottom") ## 下部
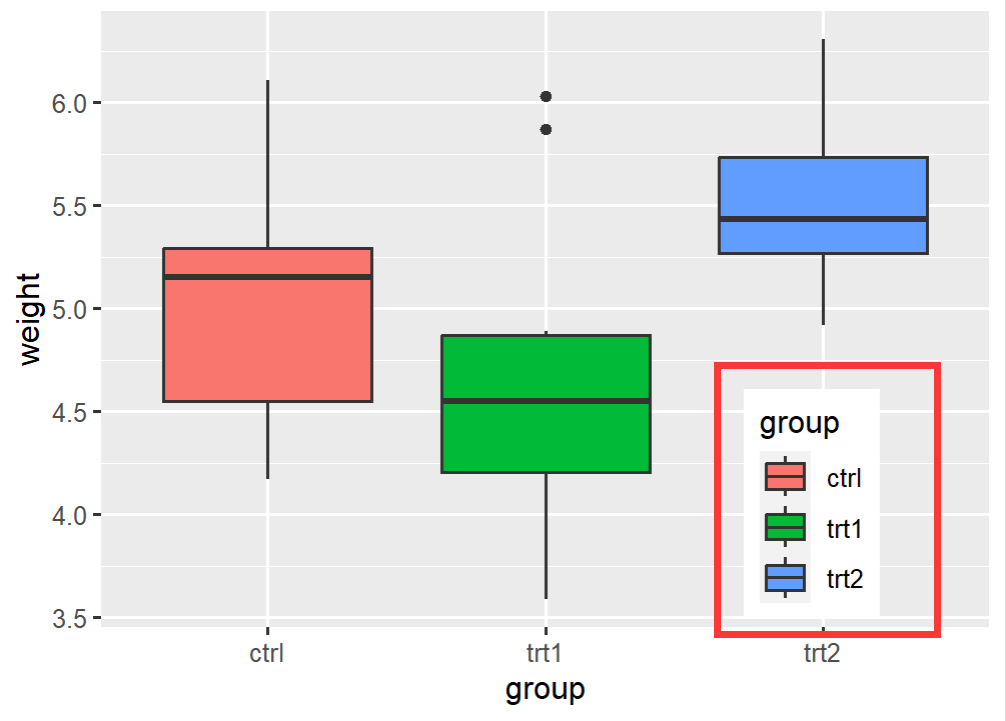
005、 也可以根据坐标来设置图例的位置, 左下角为 (0,0), 右上角为(1,1)
bp + theme(legend.position=c(.8, .2))
参考:https://www.jb51.net/article/256254.htm


【推荐】国内首个AI IDE,深度理解中文开发场景,立即下载体验Trae
【推荐】编程新体验,更懂你的AI,立即体验豆包MarsCode编程助手
【推荐】抖音旗下AI助手豆包,你的智能百科全书,全免费不限次数
【推荐】轻量又高性能的 SSH 工具 IShell:AI 加持,快人一步
· 震惊!C++程序真的从main开始吗?99%的程序员都答错了
· 【硬核科普】Trae如何「偷看」你的代码?零基础破解AI编程运行原理
· 单元测试从入门到精通
· 上周热点回顾(3.3-3.9)
· winform 绘制太阳,地球,月球 运作规律
2022-03-23 plink软件删除非ATCG的位点
2022-03-23 linux中如何删除文件的最后几行
2022-03-23 centos 和ubuntu中 rename命令使用的区别
2022-03-23 ping: www.baudu.com: Temporary failure in name resolution
2022-03-23 linux中awk命令实现在指定批量列前后添加内容
2022-03-23 linux中awk命令连续提取文件的前几列、中间若干列,后几列数据
2022-03-23 linux中awk命令提取连续列