
R语言中ggplot2绘图如何同时清除灰色背景、框格、上框线和右框线
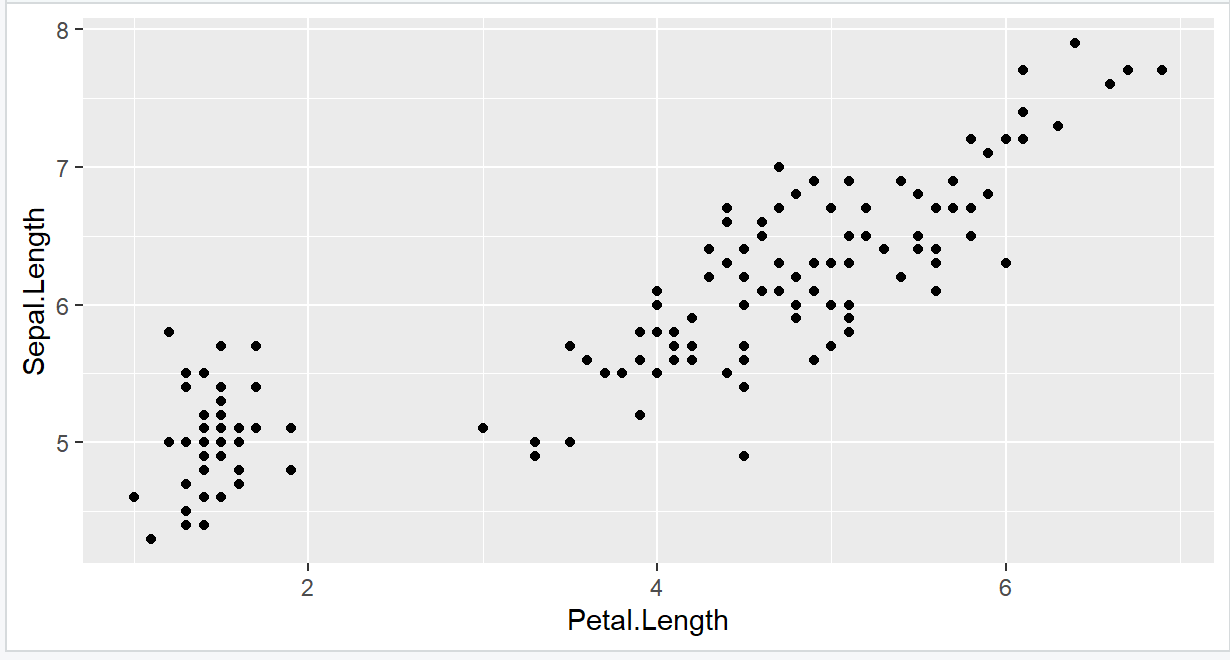
001、测试基本绘图
data=iris                               ## 导入数据
library(ggplot2)                        ## 加载包
ggplot(data = data, aes(x=Petal.Length,y=Sepal.Length)) +       ## 基本绘图程序
  geom_point()
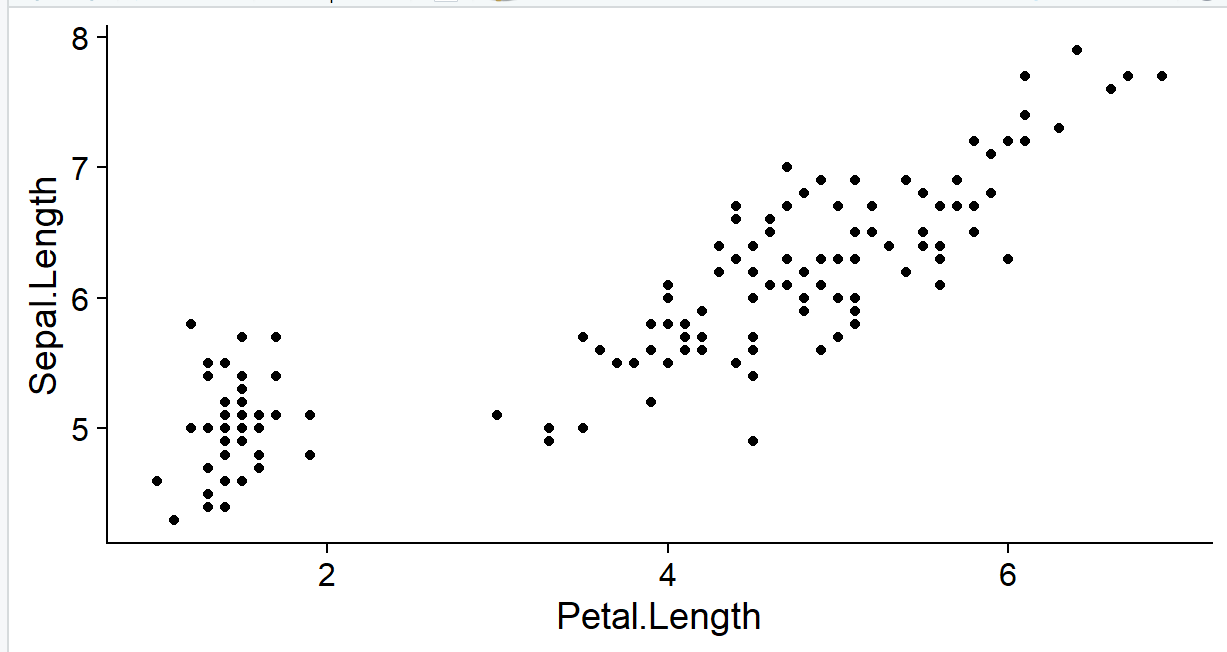
002、清除灰色背景、背景框线、上框线、右框线
data=iris
library(ggplot2)
library(cowplot)                              ##  使用cowplot包
ggplot(data = data, aes(x=Petal.Length,y=Sepal.Length)) +
  geom_point() + theme_cowplot()              ## 增加 + theme_cowplot()语句


【推荐】国内首个AI IDE,深度理解中文开发场景,立即下载体验Trae
【推荐】编程新体验,更懂你的AI,立即体验豆包MarsCode编程助手
【推荐】抖音旗下AI助手豆包,你的智能百科全书,全免费不限次数
【推荐】轻量又高性能的 SSH 工具 IShell:AI 加持,快人一步
· 震惊!C++程序真的从main开始吗?99%的程序员都答错了
· 【硬核科普】Trae如何「偷看」你的代码?零基础破解AI编程运行原理
· 单元测试从入门到精通
· 上周热点回顾(3.3-3.9)
· winform 绘制太阳,地球,月球 运作规律
2021-09-09 c primer plus 10 编程练习