
seurat单细胞数据分析实现 DimHeatmap函数
上游分析:https://www.jianshu.com/p/4f7aeae81ef1
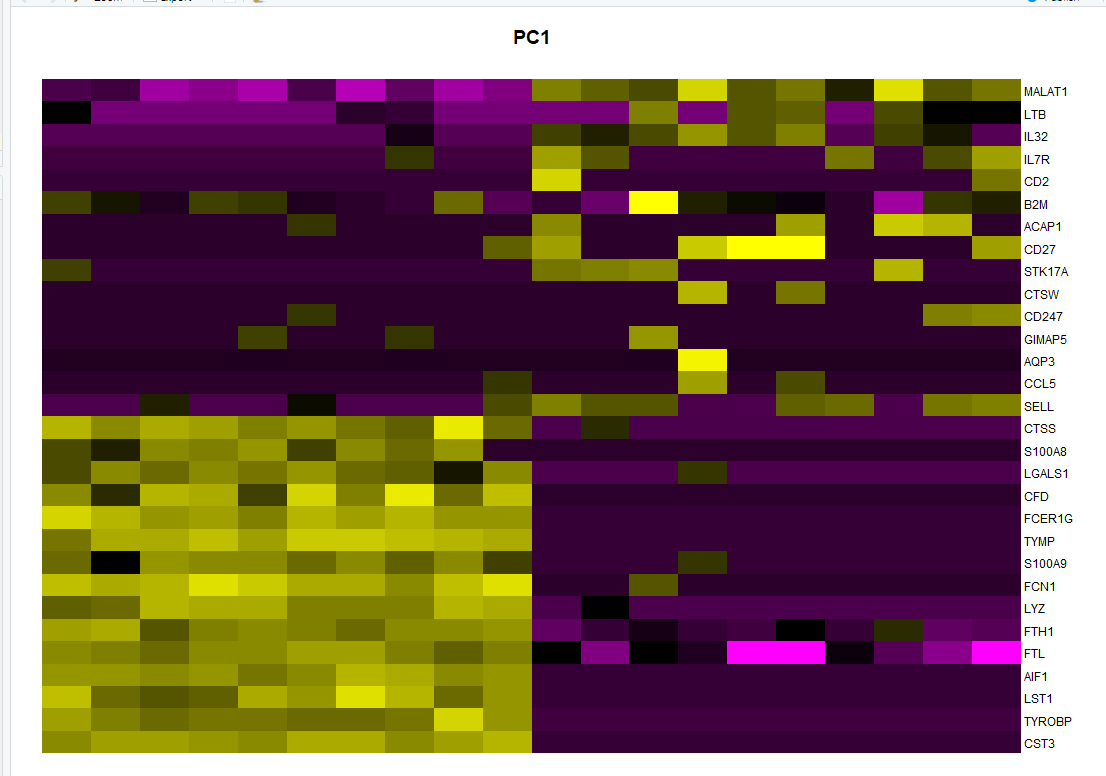
001、

cell <- pbmc[["pca"]]@cell.embeddings
cell <- cell[order(cell[,1], decreasing = T),]
cell <- rownames(cell)[c(1:10, (length(rownames(cell)) - 9):length(rownames(cell)))]
cell                                                        ## 提取细胞

feature <- pbmc[["pca"]]@feature.loadings
feature <- feature[order(feature[,1], decreasing = T),]
feature <- rownames(feature)[c(1:15, (length(rownames(feature)) - 14):length(rownames(feature)))]
feature                                                     ## 提取基因

dat <- pbmc[["RNA"]]@scale.data
dat <- t(dat)[cell, feature]                                ## 提取绘图数据

par(mar = c(1, 1, 3, 5))
plot.new()
image(dat, axes = FALSE,add = TRUE,                         ## 绘图
  col = PurpleAndYellow()
)
axis(side = 4, at = seq(0, 1, length = ncol(dat)), labels = colnames(dat),
  las = 1, tick = FALSE, mgp = c(0, -0.5, 0), cex.axis = 0.75
)
title(main = "PC1")
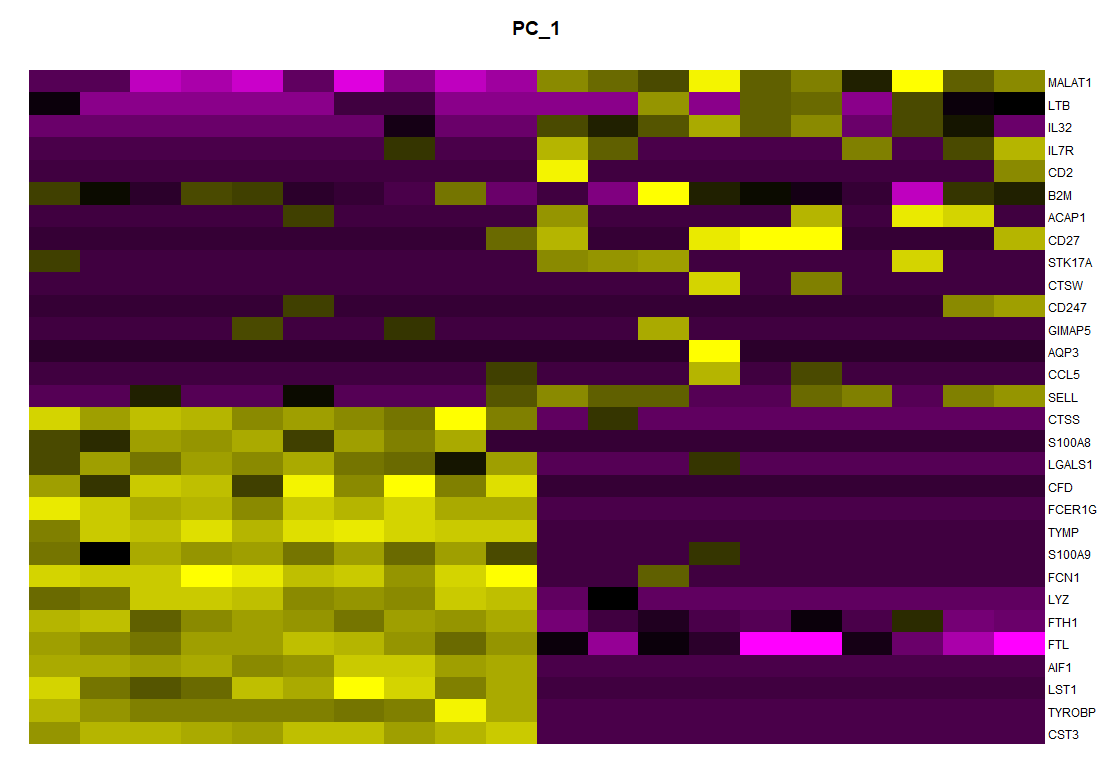
002、标准答案
DimHeatmap(pbmc, dims = 1, cells = 20, balanced = TRUE)
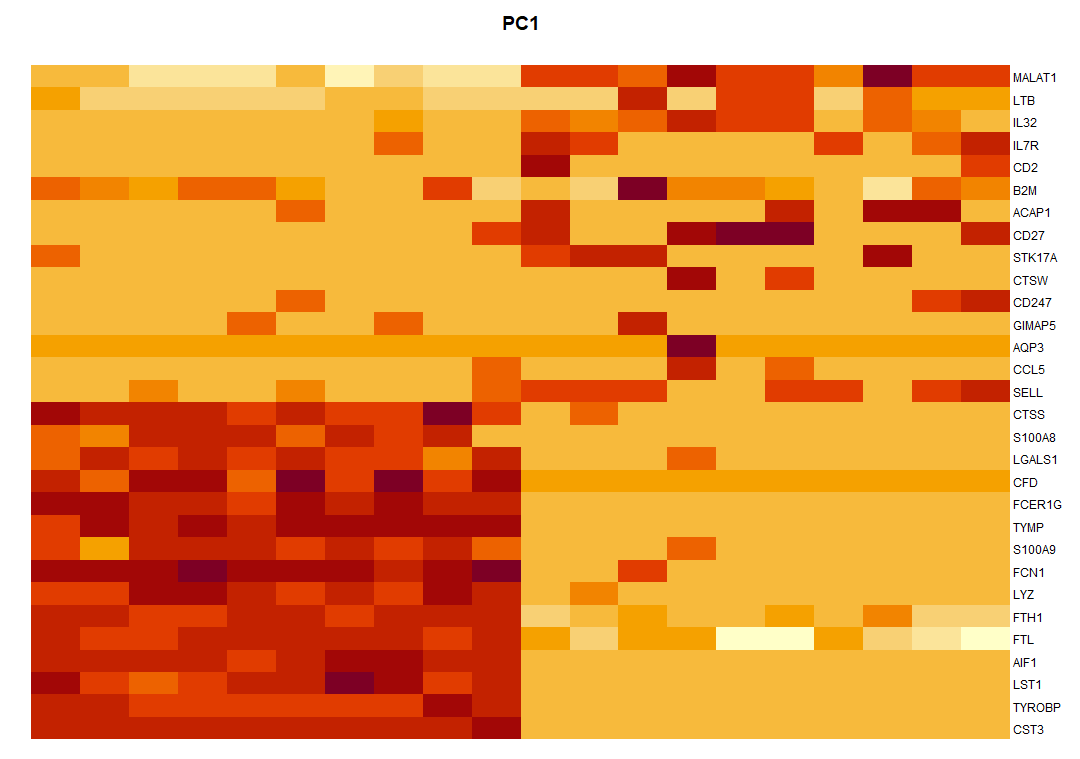
003、使用默认颜色
par(mar = c(1, 1, 3, 5))
plot.new()
image(dat, axes = FALSE,add = TRUE,
  #col = PurpleAndYellow()
)
axis(side = 4, at = seq(0, 1, length = ncol(dat)), labels = colnames(dat),
  las = 1, tick = FALSE, mgp = c(0, -0.5, 0), cex.axis = 0.75
)
title(main = "PC1")
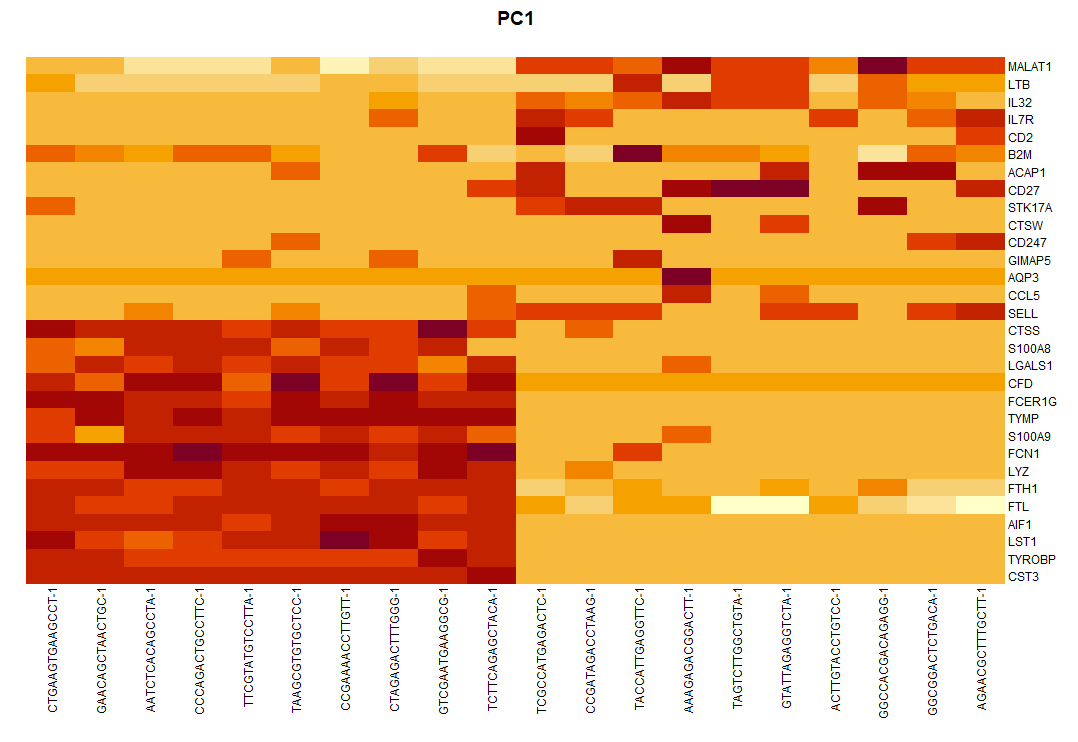
004、增加细胞名称
par(mar = c(9, 1, 3, 5))
plot.new()
image(dat, axes = FALSE,add = TRUE,
  #col = PurpleAndYellow()
)
axis(side = 4, at = seq(0, 1, length = ncol(dat)), labels = colnames(dat),
  las = 1, tick = FALSE, mgp = c(0, -0.5, 0), cex.axis = 0.75
)
axis(side = 1, at = seq(0, 1, length = nrow(dat)), labels = rownames(dat),               ## 增加细胞名称
     las = 2, tick = FALSE, mgp = c(0, -0.5, 0), cex.axis = 0.75
)
title(main = "PC1")


【推荐】国内首个AI IDE,深度理解中文开发场景,立即下载体验Trae
【推荐】编程新体验,更懂你的AI,立即体验豆包MarsCode编程助手
【推荐】抖音旗下AI助手豆包,你的智能百科全书,全免费不限次数
【推荐】轻量又高性能的 SSH 工具 IShell:AI 加持,快人一步
· 震惊!C++程序真的从main开始吗?99%的程序员都答错了
· 【硬核科普】Trae如何「偷看」你的代码?零基础破解AI编程运行原理
· 单元测试从入门到精通
· 上周热点回顾(3.3-3.9)
· winform 绘制太阳,地球,月球 运作规律