
R语言中 par(mar = 。。。) par(mai = 。。。)
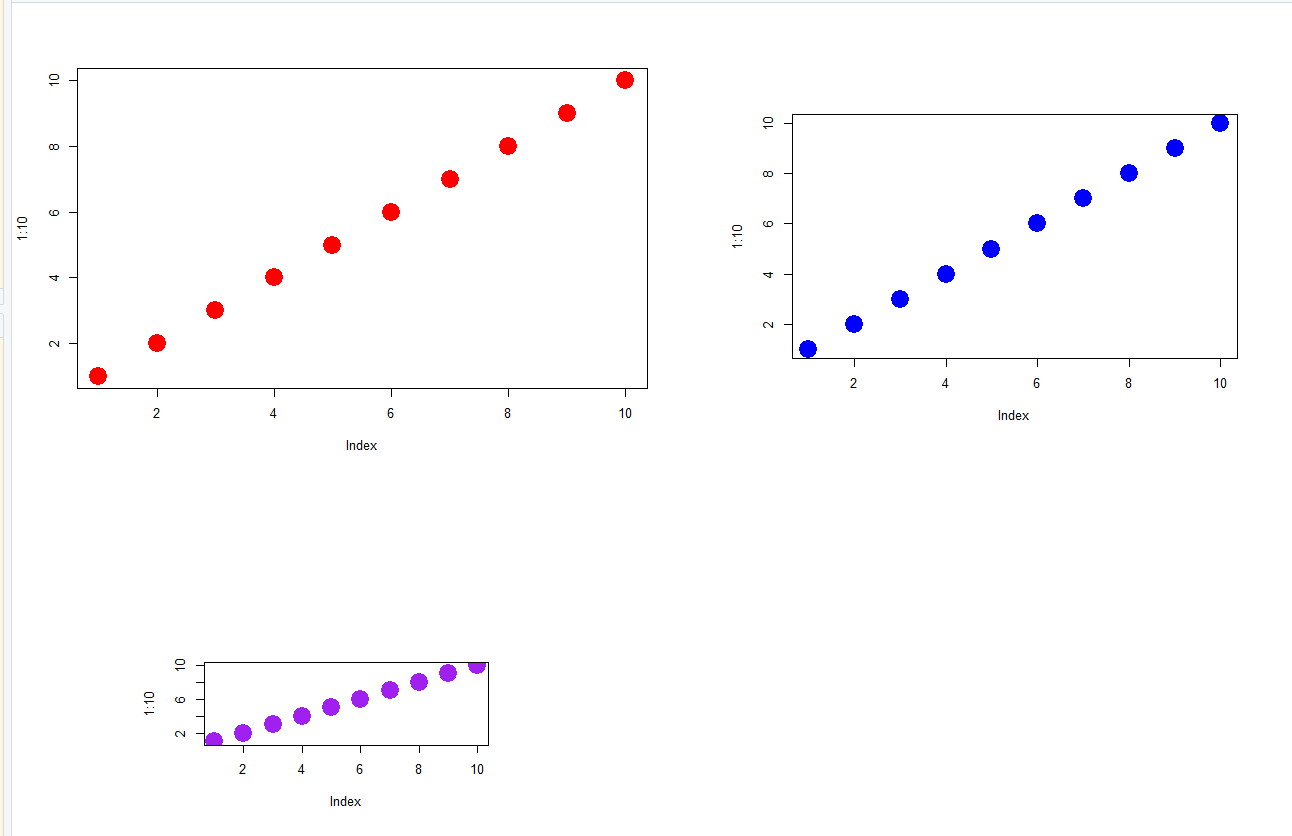
par(mar = ...)、par(mar = ...)均为调整绘图区域与边框之间的距离。
001、
par(mfrow = c(2, 2))
plot(1:10, cex = 3, col = "red", pch = 19)
par(mar = c(7, 7, 7, 7))
plot(1:10, cex = 3, col = "blue", pch = 19)
par(mai = c(2, 2, 2, 2))
plot(1:10, cex = 3, col = "purple", pch = 19)


【推荐】国内首个AI IDE,深度理解中文开发场景,立即下载体验Trae
【推荐】编程新体验,更懂你的AI,立即体验豆包MarsCode编程助手
【推荐】抖音旗下AI助手豆包,你的智能百科全书,全免费不限次数
【推荐】轻量又高性能的 SSH 工具 IShell:AI 加持,快人一步
· 震惊!C++程序真的从main开始吗?99%的程序员都答错了
· 【硬核科普】Trae如何「偷看」你的代码?零基础破解AI编程运行原理
· 单元测试从入门到精通
· 上周热点回顾(3.3-3.9)
· winform 绘制太阳,地球,月球 运作规律
2021-08-29 c语言中统计文件行数
2021-08-29 c语言统计文件单词数
2021-08-29 c语言中统计单词数目